SPATIAL PATTERNS OF WOODY PLANT SPECIES: A CASE STUDY IN MIXED BROADLEAF - CONIFEROUS FORESTS FROM KON CHU RANG NATURE RESERVE, VIETNAM
Institute of Tropical Ecology, Joint Vietnam-Russia Tropical Science and Technology Research Center, 63 Nguyen Van Huyen Str., Nghia Do, Hanoi, Vietnam
63 Nguyen Văn Huyen Str., Nghia Do, Hanoi
Số điện thoại: +84 988191288; Email: danghungcuong@gmail.com
Nội dung chính của bài viết
Tóm tắt (Abstract)
This study examined the structure and spatial organization of the mixed broadleaf-conifer forest community in the Kon Chu Rang Nature Reserve, a protected area within Vietnam’s Central Highlands known for its ecological diversity and role as a watershed for surrounding regions. Using detailed field inventories, we characterized both floristic composition and stand structure, assessing importance value indices (IVI) to gauge species dominance and combining these metrics with quantitative analyses of canopy stratification and tree-size distributions. Results indicate a diverse stand in an intermediate successional stage, with no single taxon attaining absolute dominance; several species exhibited IVI values above 5 %, suggesting the community is functionally balanced with multiple key contributors. Vertical structure analysis revealed the canopy is stratified into three layers, with the majority of individuals occupying the mid‑canopy between approximately 15.5 m and 21.5 m. Tree height distribution approximated a normal curve and diameter distribution followed an inverted J‑shape, patterns typically associated with natural stands that maintain both structural stability and strong regenerative capacity. Spatial point‑pattern analysis using Ripley’s K‑function identified roughly 12m as a critical spatial threshold for aggregation, capturing interactions among seedlings, saplings, and adult trees and corresponding to the biological neighbourhood of competitive influence in this ecosystem. This multi‑scale perspective underscores the importance of selecting appropriate spatial scales when interpreting ecological processes and highlights the value of maintaining a mosaic of size classes across the landscape. Together, these findings suggest that mixed broadleaf - conifer stands in Kon Chu Rang are resilient under current conditions. Sustainable management should therefore prioritize maintaining natural conditions, limiting large‑scale disturbance, and supporting regeneration processes, particularly within a 10 - 12 m radius around mature trees, to ensure long‑term ecosystem sustainability, biodiversity conservation, and continued provision of ecosystem services.
Từ khóa (Keywords)
spatial point-pattern analysis, Ripley’s K function, species aggregation, Importance Value Index (IVI), stand structure, mixed broadleaf - coniferous forest, Central Highlands Vietnam
Chi tiết bài viết

This work is licensed under a Creative Commons Attribution 4.0 International License.
- Highlights:
The mixed broadleaf - conifer forests of Kon Chu Rang exhibit high species diversity and balanced composition, comprising 79 species from 43 families, several of which make significant ecological contributions..
The stand structure shows a near-normal height distribution, indicating an intermediate successional stage characterized by a three-layered canopy and stable height - diameter relationships.
The inverted J-shaped DBH distribution reflects a structurally stable forest with strong regenerative capacity, indicating high resilience under current conditions.
Spatial point-pattern analysis identified 12 m as the critical threshold for species aggregation, reflecting the biological neighborhood of competitive influence.
Sustainable management should prioritize maintaining natural conditions, limiting disturbances, and supporting regeneration within a 10 - 12 m radius around mature trees.
1. INTRODUCTION
Alongside the rapid development of ecosystem science, modern research trends are also shifting from small-scale observational and experimental approaches toward large-scale observation, network experiments, and modeling simulations. The acquisition of high-density, large-scale networked ecological data has entered a new phase of rapid growth. Modern ecosystem observation technologies are transforming traditional studies of water, soil, air, and biotic factors into investigations of the overall structure and functioning of ecosystems. Among these methods, spatial distribution modeling is one of the key analytical tools in modern ecology, particularly in studies of the structure and dynamics of forest plant communities [1]. By quantifying spatial patterns, researchers can elucidate the mechanisms that maintain biodiversity, clarify the influence of environmental and biological factors, and assess the impacts of historical processes on current plant distribution patterns [2].
Building upon this framework, current research on spatial distribution models focuses on clarifying the structure and organization of forest plant communities. By analyzing these models, researchers can identify dominant species groups, investigate vegetation stratification, and assess the influence of environmental factors on species distribution [3]. These models also provide evidence of interspecific competition by revealing whether species distributions are concentrated or dispersed, thereby allowing inferences about the interaction processes and the impact of competition on community dynamics [4]. Consequently, spatial distribution models are also highly applicable in forest conservation and management, helping to identify high-biodiversity areas that require conservation priority, and proposing suitable locations for afforestation or habitat restoration that align with the natural structure of the ecosystem [5].
One of the most widely used tools for describing and quantifying the spatial distribution of individuals is Ripley's K-function. This model allows for assessing whether points (e.g., individual trees) are randomly distributed, clustered, or uniformly distributed in two-dimensional space. Many studies in tropical and temperate forests have successfully used Ripley's K function to analyze the distribution of woody species in both the canopy and understory [6]. Furthermore, the model has been extended to analyze spatial relationships among different species. Several studies have shown that analyzing spatial interactions between species can shed light on competitive or facilitative phenomena [7]. Based on these research findings, Ripley's K function is commonly used in forestry to help determine optimal planting densities to reduce competition and in forest conservation management to guide the design of restoration plans based on natural spatial structures.
In Vietnam’s Central Highlands, the Kon Chu Rang Nature Reserve is a core area of the Kon Ha Nung Plateau Biosphere Reserve, characterized by extensive mixed broadleaf - conifer forests, valuable timber species, and rare flora. Despite its ecological significance, research has so far focused mainly on biodiversity surveys, with little attention to forest structure or the spatial distribution of woody plants. Recent studies applying Ripley’s K function in different regions of Vietnam - such as Ba Be, Tan Phu, Con Dao, and Kon Ka Kinh - have revealed species-specific clustering, competition, and random distribution patterns, offering important insights for conservation and forest management [8,9]. However, such research remains limited, particularly in Kon Chu Rang, underscoring the need for further investigation into its community structure and spatial dynamics.
This study fills an important knowledge gap by analyzing the spatial distribution patterns of woody species in the mixed broadleaf - conifer forests of Kon Chu Rang Nature Reserve. We quantified the spatial arrangements of dominant species to develop a clearer understanding of community structure and species interactions. Together with related studies in Kon Ka Kinh National Park, our findings provide evidence-based insights to guide conservation and sustainable management of mixed forests in the Kon Ha Nung Biosphere Reserve and similar ecosystems in the Central Highlands.
2. MATERIALS AND METHODS
2.1. Study area
The study was conducted from July to September 2024 in Kon Ch Rang Nature Reserve, northeastern Gia Lai Province. Situated at the transition between the northern and southern Annamite Mountains, the Reserve harbors diverse tropical forests and provides critical habitat for rare and endemic species. Vegetation types include evergreen broadleaf forest, mixed broadleaf - coniferous forest, and grassland - shrubland. For this study, a standard 1-hectare plot (100 × 100 m) was established in a mixed forest within the legally protected core zone (Figure 1).

Figure 1. The location of the standard plot on the Map of Vietnam.
2.2. Data collection
In each standard plot, all woody plant individuals with a diameter at breast height (DBH, measured at 1.3 m above ground) ≥ 5 cm were identified and counted. This criterion was chosen because trees with DBH ≥ 5 cm have typically passed the seedling or sapling stage and begun contributing to canopy structure, making them more representative of the stand’s structural and dynamic characteristics. Moreover, this threshold is widely adopted in both national and international forest ecology studies, ensuring greater comparability and generalizability of the results [10,11]. The spatial coordinates of each tree were recorded using a Garmin eTrex 64S GPS device. Tree diameter was measured with a specialized DBH tape, and total tree height (Hvn) was measured using a Blume - Leiss hypsometer. This procedure ensured accurate and consistent data collection for both structural and spatial analyses. Detailed data on individual trees are presented in Appendix I.
2.3. Data analysis
2.3.1. Species identification
The plants were identified by botanists based on taxonomic references such as “An illustrated flora of Vietnam” [12], “Timber resources in Vietnam” [13] and an on-going updated series of “Flora of Vietnam” [14]. Plant identifying also included comparing collected plants with the voucher specimens in herbaria and scanned herbarium images of type specimens from various online sources. The plant nomenclature was mapped to to accepted names from Plants of the World Online (POWO) and identified synonyms, and updated with POWO taxonomic information.
2.3.2. Statistical analysis
Dominant species: The Importance Value Index (IVI) is a widely used quantitative measure in forest structure analysis to determine the ecological significance of a species within a community. For each species in the inventory data, we calculated IVI (Equation 3) that typically combines two parameters: tree density (stem count - N) (Equation 1) and stem cross-sectional (G) (Equation 2). Dominant species were defined as having an IVI greater than 5% and were considered to be ecologically important that play a critical role in shaping stand dynamics, influencing regeneration patterns, resource competition, and overall community stability [15].
Table 1. A list of the spatial indexes and functions used to analyse data
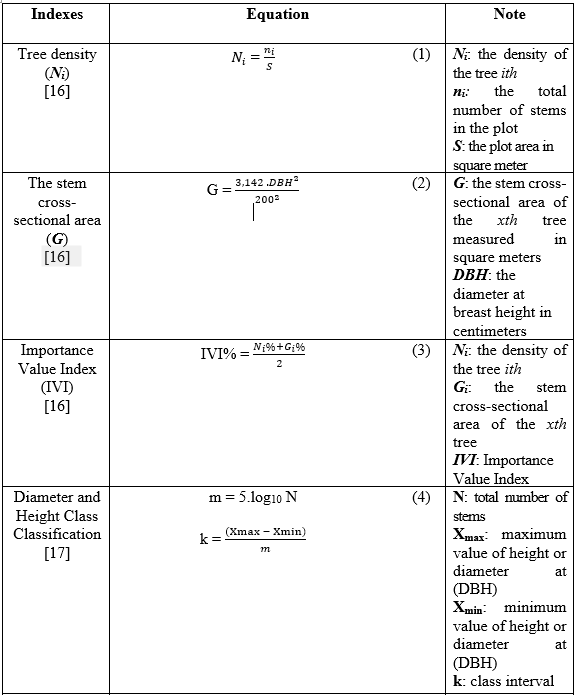
Selecting species for spatial pattern analysis: When species are ranked in descending order of their IVI%, the point at which the cumulative IVI% reaches 75% signifies that the collective importance of these species constitutes three-quarters of the total community's importance. These species are considered dominant contributors to the community's overall structure and composition and are therefore selected for detailed spatial pattern analysis.
Forest canopy division: canopy stratification was determined following the classical framework of Richards [20], later reaffirmed by Whitmore and Bongers for tropical forests [21,22]. According to these references, tropical forest structure typically comprises three strata: an emergent layer representing about 10% of individuals; a dominant main canopy layer containing 65 - 80% of individuals and forming the structural - ecological core of the stand; and a sub-canopy composed of suppressed or regenerating individuals. Thus, the canopy division applied in this study is both theoretically grounded and empirically validated.
Diameter and Height Class Classification: DBH and Hvn were grouped into size classes to facilitate structural analyses. The DBH data were classified into 4-cm intervals (e.g., 0 - 4, 4 - 8, 8 - 12 cm, etc.), while tree height was divided into 2 - 5 m intervals depending on tree size. These class widths are commonly used in traditional tropical forest structure studies in Vietnam and are theoretically derived from a modified version of Sturges’ rule, which determines the optimal number of classes in a frequency histogram. Following the recommendations of Valente and Sánchez-Rodríguez (2019) - who applied similar class-interval methods in tropical forest analyses - we adopted this modified approach to ensure both sufficient resolution and adequate sample representation per class [17].
Vertical forest structure refers to the number of tree layers and is one of the critical attributes of forest structure, and it is a crucial factor in determining the ecological processes. Retangular subplot of 40m × 10m was set inside the 1-hectare plot. To visualize the vertical stratification of the forest stand, a detailed vertical profile was generated using Statgraphics Centurion software, following the approach recommended by David Richards [20]. The software enabled the integration of tree height, diameter, and spatial coordinate data from the study plot to produce a precise and reproducible vertical section. This method provides a more accurate representation of canopy layering and facilitates quantitative analysis of stand architecture and species distribution, offering a more robust and objective depiction of forest structure compared to hand-drawn profiles.
2.3.3. Spatial analysis
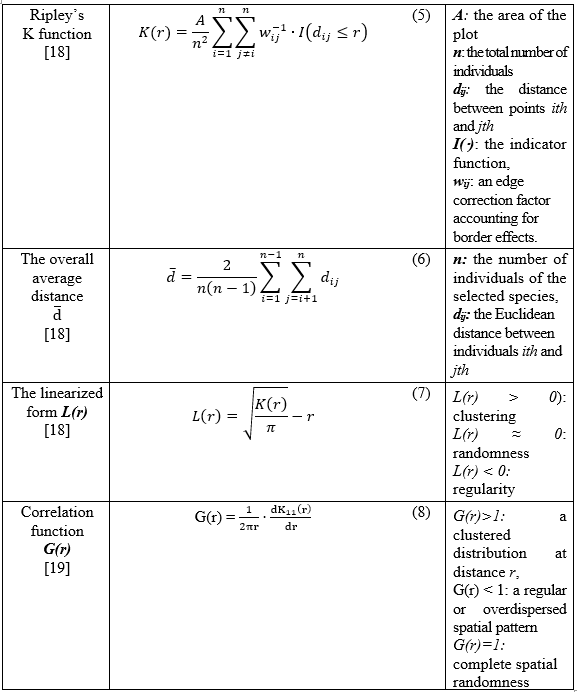
To characterize the spatial cohesion of the dominant species, we calculated the average distance between theses individuals. The pairwise Euclidean distances between all tree individuals belong to the group of contributor dominants that total cumulative IVI% reaches 75% signifies were computed (excluding self-pairs), and the overall average distance (![]() (Equation 6) was obtained. This metric quantifies the spatial dispersion within the dominant community subset.
(Equation 6) was obtained. This metric quantifies the spatial dispersion within the dominant community subset.
To quantify the spatial distribution patterns of dominant tree species within the standard plot, we applied Ripley’s K function, a second-order spatial point pattern analysis method widely used in ecological studies (Equation 5 - 8). This function evaluates whether the observed distribution of individuals deviates from complete spatial randomness (CSR) across a range of spatial scales. For each species selected based on the cumulative IVI% threshold, spatial point data (tree coordinates) were analyzed to compute the K-function. The K-function accumulates the number of neighbors within radius r for each point and normalizes this by the intensity of the point pattern. To facilitate interpretation, the linearized form L(r) (Equation 7) was used to indicate clustering (L(r) > 0), randomness (L(r) ≈ 0), or regularity (L(r) < 0).
To further examine the scale-dependent structure, we computed the pair correlation function, denoted as the first derivative of Ripley’s K function as G(r) (Equation 8). This function provides a normalized estimate of the expected density of neighboring points at distance r, relative to complete spatial randomness (CSR). When G(r)=1, the point pattern is consistent with CSR. If G(r)>1, it indicates a clustered (aggregated) distribution at distance r, while G(r) < 1 suggests a regular (uniform) or overdispersed spatial pattern. This derivative-based approach enhances the resolution of scale-dependent analysis, making it particularly useful for detecting characteristic distances at which tree individuals are more (or less) likely to occur relative to a random expectation.
In this study, the spatial distribution of dominant tree species was analyzed using both Ripley’s L-function and the pair correlation function G(r), providing complementary insights into underlying spatial patterns. The Ripley’s K function, together with its L-transformation, was adopted as the primary spatial analysis tool, as it provides a multi-scale framework capable of detecting and quantifying species clustering or dispersion across multiple distances rather than being restricted to a single spatial scale. Compared with alternative approaches such as the nearest-neighbor method (which reflects only local-scale patterns), quadrat analysis (which depends on grid size), or parametric point-process models (which require complex assumptions), Ripley’s K/L offers clear advantages in visual interpretability, analytical flexibility, and widespread applicability in tropical forest studies. Hence, this method is particularly appropriate for the pilot objectives of the present study, which aim to identify ecological spatial thresholds within the woody plant community. In the analysis, the null hypothesis (H₀) was defined as Complete Spatial Randomness (CSR), assuming that all individuals are independently and uniformly distributed across the plot area according to a homogeneous Poisson process. This baseline model provides a reference for detecting departures from randomness, such as clustering or regularity, and follows the theoretical framework described by Wiegand & Moloney (2013) [23]. The radius (r) was evaluated from 0 up to half of the shortest plot dimension to minimize edge effects, following Ripley’s standard edge-correction procedure to account for circles extending beyond plot boundaries. This approach provides a robust quantitative framework for assessing spatial heterogeneity and interspecific interactions within forest stands.
All computations were performed in Python, using customized scripts developed on the spatstat framework to ensure analytical consistency and reproducibility. Spatial data were processed within the same environment using the pyproj, shapely, and geopandas packages, which supported geodesic distance calculations, spatial geometry operations, and geospatial data management. Together, these tools provided a reliable and reproducible workflow for the spatial analysis of tree coordinates.
The L-function, L(r), as a cumulative measure, effectively captured overall tendencies of clustering or regularity across broader spatial scales, allowing for the detection of general deviations from complete spatial randomness. In contrast, the pair correlation function offered finer resolution by quantifying the local density of neighboring trees at specific distances, thereby identifying characteristic scales of aggregation or spacing that may be ecologically meaningful. The combined application of these two functions enabled a robust assessment of spatial structure, revealing both large-scale distributional trends and localized interactions among trees. This dual approach enhances the interpretation of community dynamics, particularly in species-rich tropical forests, and provides a valuable framework for understanding spatial organization in relation to ecological processes such as competition, regeneration, and habitat heterogeneity.
III. Results
3.1. Structure of Mixed Broadleaf - Coniferous Plant Communities
3.1.1. Species Composition Structure
In the sample plot, a total of 79 woody species belonging to 43 families were recorded and identified. The overall density of woody species observed in the forest was 803 individuals per hectare. In the plot, each plant’s coordinate points are mapped and colored by species, that showed in Figure 2.
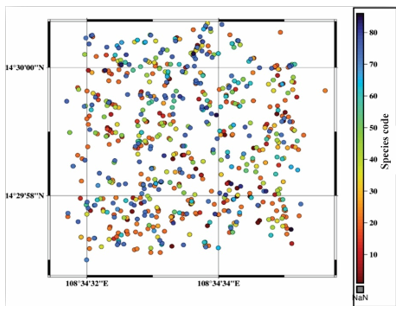
Figure 2. Diagram of coordinate distribution points of woody plants in sample plots.
Note: Rings and colors (according to the color scheme in the right column) respectively represent the location of woody plants and . Detailed data on individual tree coordinates are presented in Appendix II.
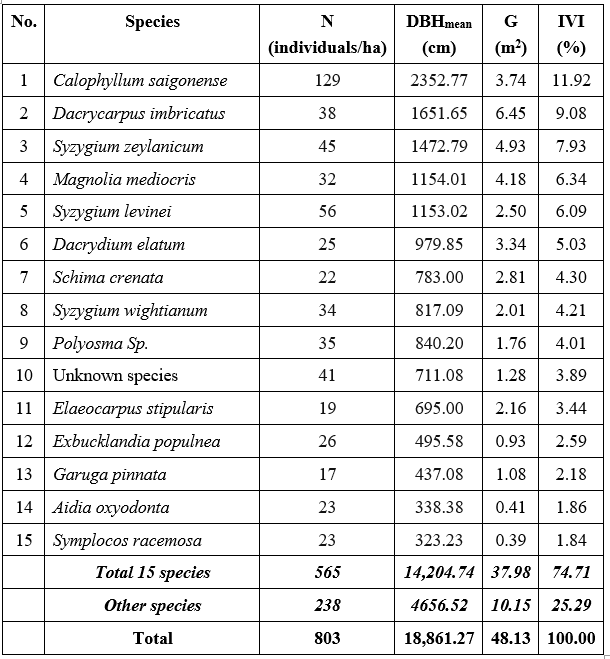
Dominance is a measure of the relative importance of species within the forest. After the evaluation by their IVI%, it revealed a high level of domination by six tree species (i.e. Calophyllum saigonense, Dacrycarpus imbricatus, Syzygium zeylanicum, Magnolia mediocris, Syzygium levinei and Dacrydium elatum) were determined as dominant trees species (Table 2). The high IVI of a species is not only indicated its dominance and ecological success but also its good power of regeneration. Among those dominating woody species, Calophyllum saigonense was the most ecologically important woody species (IVI=11.92%), followed by Dacrycarpus imbricatus (IVI=9.08%) and Syzygium zeylanicum (IVI=7.93%). The results of the sample plot data analysis are presented in detail in Appendix III.
In addition, 15 species were identified as contributing to a cumulative total exceeding 75% of the community's IVI. These species were subsequently chosen for spatial analysis (Figure 3). The main structural parameters of each individual are summarized in Table 2.

Figure 3. Cumulative IVI% of species recorded in the standard plot, arranged in descending order.
Note: Black lines represent the projection of each species’ IVI% onto the cumulative axis. The IVI% rank values and the 75% cumulative threshold are highlighted in purple text to indicate the subset of dominant species selected for spatial analysis.
Table 2. Summary of main structural parameters of the 1-hectare plot
3.1.2. Characteristics of the stratified vertical structure
The vertical structure of the study area is illustrated in the longitudinal profile shown in Figure 4. Tree height was categorized into 15 classes, each with an interval of 1.2 m. The distribution of tree frequency by height (N/H) exhibits an approximately normal pattern, peaking in the middle height range of 17.9 - 19.1 m and gradually decreasing toward both ends (Figure 5a). In contrast, diameter at breast height (DBH) was also divided into 15 classes, each with a class interval of 8.86 cm. The frequency distribution of trees by DBH class (N/DBH) displays a distinctly left-skewed shape, with a high concentration of individuals in the smaller diameter classes and a rapid decline in frequency toward the larger diameter classes (Figure 5b).
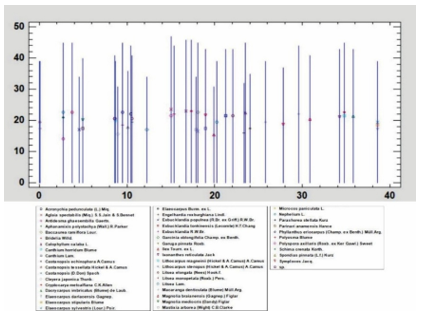
Figure 4. Vertical structural profile illustrating tree height distribution in the standard plot.
Note: X-axis represents the horizontal position of trees (0 - 40m); the Y-axis indicates tree height (H)
The classification of the mid-canopy between 15.5 m and 21.5 m was quantitatively determined based on field measurements of tree height distributions. The majority of individuals (approximately 70% of total stems) were concentrated within this range, forming a statistically well-defined peak in the height-frequency curve (Fig. 5a). This interval thus represents the ecologically dominant stratum, where most competitive interactions and biomass accumulation occur. The thresholds (15.5 m and 21.5 m) correspond to the lower and upper inflection points of the bell-shaped curve, thereby delineating the vertical zone that supports the majority of canopy trees. This empirical definition is consistent with the structural models of Richards [20] and Whitmore [21], which emphasize the predominance of a middle canopy layer containing most individuals, in contrast to fewer emergents above and smaller suppressed trees below. Classification of diameter and height classes is presented in Appendix IV.
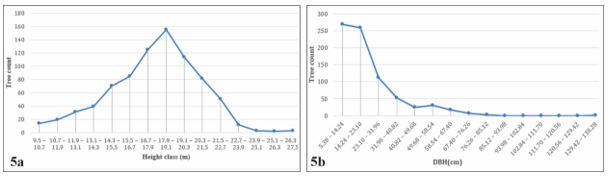
Figure 5. Line chart of diameter at tree height (panel 5a) and breast height (panel 5b) distribution
The classification of the stand as being in an intermediate successional stage was determined based on a combination of structural and quantitative indicators. The division of canopy layers followed the framework of Richards in The Tropical Rain Forest: An Ecological Study, which distinguishes three principal strata [20]. Field measurements revealed a well-defined three-layer canopy structure, with the tree height distribution approximating a normal curve centered within the mid-canopy (17.9 - 19.1 m). This bell-shaped pattern reflects stable stem competition following disturbance and corresponds to the stem exclusion phase within the four-stage stand development model proposed by Oliver & Larson (1996) (stand initiation, stem exclusion, understory reinitiation, old-growth) [24]. The dominance of medium-sized trees, together with the relative balance across height and diameter classes, indicates a structurally complex community characteristic of an intermediate stage, in which the stand is still transitioning but has not yet attained the fully developed multi-layered equilibrium typical of old-growth forests. Quantitative evidence supporting this classification was derived from field data, height-frequency histograms (Fig. 5a), and vertical stand profiles (Fig. 4). Thus, the classification as an intermediate successional stage is substantiated by the presence of three distinct canopy layers, a bell-shaped height and diameter distribution centered in the mid-canopy, and structural features consistent with the stem exclusion phase of stand dynamics.
Forest resilience under current conditions was evaluated primarily through the analysis of tree frequency distributions by diameter class (N/DBH). The results demonstrated a distinctly left-skewed, inverted J-shaped distribution, characterized by a high concentration of small-diameter individuals and a rapid decline in frequency toward larger diameter classes (Fig. 5b). This distribution pattern is widely recognized as an indicator of continuous regeneration and strong self-replacement capacity, where the abundance of small trees represents the regenerative potential of the stand, while the relative scarcity of large trees reflects ongoing successional development. Consequently, forest resilience in this study was inferred from the sustained presence of numerous small-diameter individuals, the regeneration-driven form of the N/DBH curve, and its agreement with established ecological models of forest recovery and renewal.
3.2. The Ripley’s spatial distribution models
3.2.1. The average distance from all tree spices
565 individuals of 15 dominant species, cumulatively contributing to 75% of the total IVI, were counted. As a result, the average pairwise distance between them was calculated to be approximately 56 meters. This index quantifies the spatial dispersion within the dominant community assemblage and was further included in the spatial analysis Ripley's K-function.
3.2.2. The distribution map of G(r) and L(r)
This analysis included all dominant species contributing to the top 75% of cumulative IVI%. For each tree, G(r) and L(r) were computed across radii from 0 to 56 m (1 m increments) and stored to generate spatially explicit heatmaps. Figure 6 illustrates results at 5 m and 12 m radii, where blue areas (G(r) < 1, L(r) < 0) indicate regularity and red areas (G(r) > 1, L(r) > 0) denote clustering. This dual-function mapping highlights fine-scale spatial heterogeneity driven by species interactions, regeneration, and habitat structure.
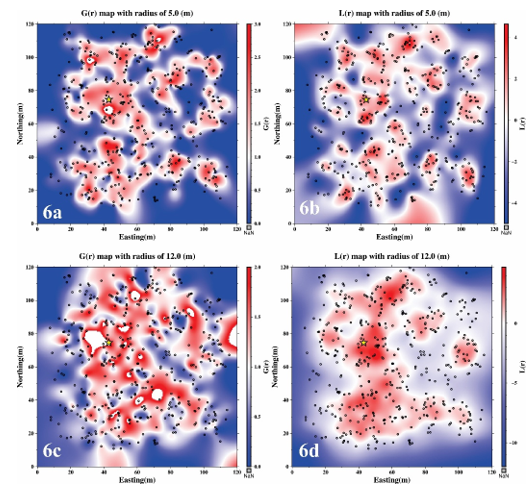
Figure 6: Spatial point-pattern maps of dominant species based on G(r) and L(r) at selected radii (5 m and 12 m).
Note: The values of the pair correlation function G(r) and the linearized Ripley’s K-function L(r) are represented by the color gradient, as indicated by the color bar. Individual tree locations are marked as black dots, and the corresponding radius for each map is indicated in the figure title. The star represent the location of the tree that shown the G(r) and L(r).
Analysis of the spatial distribution maps in 6a - b and 6c - d reveals that at a search radius of 5 m, the values of G(r) > 1 and L(r) >0 indicate a high degree of local clustering among individuals. The presence of hot-colored regions in the maps reflects the fragmentation of the population into distinct clusters, suggesting strong small-scale aggregation. These clusters are primarily localized, highlighting the fine-scale heterogeneity in the spatial arrangement of dominant tree individuals. For instance, Figure 6b illustrates a pronounced concentration of clusters in the central region of the plot, as evidenced by elevated L(r) values.
In contrast, at a larger search radius of 12 m, the spatial pattern reveals a higher degree of connectivity among the clustered zones. The red-colored areas, representing strong aggregation, are no longer confined to the center but extend towards the edges of the plot. The corresponding L(r) function shows a broader and more continuous clustering structure, with a notable orientation along the North - South axis and increased intensity towards the western portion of the plot. Similarly, the G(r) function reflects a comparable pattern of large-scale aggregation.
These results suggest that the critical scale at which the dominant species exhibit a well-defined clustered spatial structure is approximately 12 m. At smaller scales, such as 5 m, the pattern appears more fragmented and localized, while values closer to 12 m better capture the cohesive spatial organization of the population.
Figure 7 presents an example of the pair correlation function G(r) and the linearized Ripley’s K-function L(r) plotted against search radius for tree individual Dacrycarpus imbricatus - S0058, which is located in a region of pronounced clustering. The two curves illustrate how the values of functions change with increasing radius, providing the scale-dependent nature of spatial aggregation around this tree. Notably, both functions exhibit values greater than the expected threshold under complete spatial randomness, particularly in the range from 5 m to 15 m for G(r) line, indicating significant local clustering. The purple horizontal lines in the graph represent the theoretical thresholds distinguishing between clustered (above the line) and fragmented or dispersed (below the line) spatial patterns. The simultaneous elevation of both functions above these thresholds confirms that Dacrycarpus imbricatus is situated within a high-density cluster, and the trend curves reveal the spatial scales at which this aggregation is most pronounced.
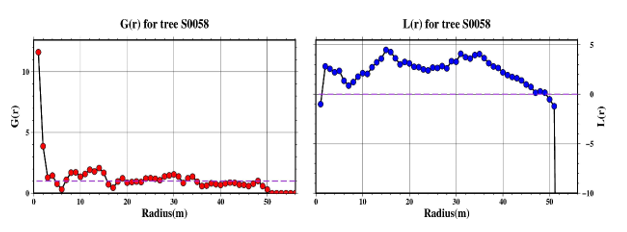
Figure 7. Example of G(r) and L(r) functions for Dacrycarpus imbricatus (S0058) located in a highly clustered area.
Note: The curves show function trends across search radii, with purple lines indicating thresholds between clustered and dispersed patterns
IV. Discussion
The species composition at Kon Chu Rang reflects a highly diverse, mixed forest community that is not dominated by a single species. The finding indicates that no species has an IVI exceeding 50%, with only six woody species having an IVI greater than 5%. This suggests a relatively even distribution among species, with no single species having absolute dominance. This pattern is characteristic of an intermediate successional stage, where species are actively competing for ecological niches. In comparison, the mixed forest community at the nearby Kon Ka Kinh National Park shows a few dominant species, such as Dacrycarpus imbricatus (19% IVI) and Syzygium cinereum (12.3% IVI). Other species like Castanopsis ceratacantha and Chukrasia tabularis only reached around 5% IVI [8]. This difference highlights that in Kon Chu Rang NR, more even species distribution which signifies greater ecosystem stability and sustainability.
Recent ecological studies have demonstrated that pronounced dominance by a small number of species is often associated with communities experiencing intense disturbance or occupying early successional stages. For instance, in Cameroon, the mean IVI of unlogged evergreen forests was higher than that of logged forests, while the latter exhibited extremely high IVI values for a few species (e.g., Uapaca guineensis with 89.6% in primary forest and Triplochiton scleroxylon with 47.6% in logged forest). Such disparities highlight the influence of timber extraction on community structure and the emergence of species dominance [25]. Similarly, a study on successional trajectories revealed that species with high IVI values during early stages (e.g., Fabaceae) often lose their dominant role in later stages [26]. In contrast, the relatively even distribution and moderate IVI values observed across numerous species in Kon Chu Rang suggest that the community is not subject to severe disturbance and is advancing toward ecological stability. High species diversity and evenness further enhance the community’s resilience to environmental fluctuations and support the maintenance of long-term ecosystem functioning [27]. Thus, the absence of absolutely dominant species, together with the presence of multiple species exhibiting IVI ≥ 5%, provides evidence of a structurally stable ecosystem with substantial adaptive capacity.
The woody plant community in Kon Chu Rang Nature Reserve can be stratified into three vertical layers, with the dominance of the A2 layer indicating that the mid-canopy plays a central role in light interception and microclimate regulation. In comparison, the mixed broad-leaved - coniferous forest of Bidoup - Nui Ba National Park exhibits a more pronounced stratification, where the emergent layer (A1) reaches heights of 30 - 40 m and is clearly characterized by the presence of large coniferous species [28]. Based on a 5 m stratification framework, the 30 - 40 m canopy is classified as the “upper layer,” and this forest also contains some emergent trees exceeding 40 m in height [29]. By contrast, the absence of a dominant emergent layer and the concentration of individuals in the mid-canopy at Kon Chu Rang suggest that the community is in an intermediate successional stage or has been shaped by disturbances that have limited the upward expansion of large coniferous species. Conversely, the more complete vertical stratification in Bidoup reflects a species-rich forest with well-developed emergent conifers.
This observation is consistent with findings from a 2024 study in Cameroon, where the forest was stratified into three groups: lower layer (0 - 10 m), middle layer (10 - 30 m), and upper layer (30 - 40 m); only trees exceeding 40 m in height were classified as emergent, and these occurred very rarely [29]. In Kon Chu Rang, the A2 layer (15.5 - 21.5 m) falls within the lower portion of the “middle layer” (10 - 30 m) under this classification, while the A1 layer (>21.5 m) does not reach 30 m and thus does not constitute a true emergent stratum. These results are consistent with findings from a study on evergreen broad-leaved forests regenerating after selective logging in Kbang District, which showed that most individuals were concentrated within a mid-canopy band (main layer: 15.5 - 21.5 m). This pattern reflects a community in the process of recovery after logging and attaining a relatively stable state [30]. By contrast, tropical forest communities with limited disturbance exhibit a more distinct vertical stratification. For example, in the Amazon, the average canopy height reaches 28.6 m, with emergent trees occasionally extending 40 - 50 m above the canopy [31], indicating a clearer differentiation between the mid-canopy and emergent layers. These comparisons suggest that the vertical structure in Kon Chu Rang is relatively lower and more homogeneous.
The height-class distribution of trees (N/H, Fig. 5a) reflects a community with a well-defined stratified canopy and a stable developmental trajectory, characterized by the concentration of individuals within the main canopy layer. Most trees occur in the ecologically dominant stratum (15.5 - 21.5 m), while only a few extend above 21.5m, producing a height-frequency curve that closely approximates a normal distribution. Such a pattern is typical of tropical forest communities in which the mid-canopy (10 - 30 m) predominates and only a small number of emergent individuals surpass 30 m [29]. The relative balance across height classes indicates that growth and competitive interactions among individuals are proceeding under stable conditions, while simultaneously reflecting the community’s regenerative capacity and recovery potential following past disturbances. This structural stability contrasts with the evergreen forests of Kon Ka Kinh NP, where a left-skewed height distribution and the prevalence of emergent conifers reveal stronger canopy stratification and dominance by large species.
The distribution of tree numbers by height and diameter classes (N/DBH) follows a left-skewed pattern (inverted J-shape) (Fig. 5b), where the number of individuals decreases as diameter increases. This is characteristic of communities undergoing regeneration or subject to strong natural selection processes. Numerous recent studies have confirmed that when regeneration occurs continuously, forest communities typically exhibit an inverted J-shaped curve, indicating an abundance of small-diameter individuals and a scarcity of large trees [32]. Similarly, a study in Ethiopia reported a decline in tree numbers with increasing diameter, forming an inverted J-shaped distribution of both height and diameter; this pattern reflects forests dominated by small individuals and in a stage of regeneration [33]. The similarity in diameter distribution between Kon Chu Rang and Kon Ka Kinh indicates that both areas are in a young or regenerating forest stage. However, differences in height distribution - near normal in Kon Chu Rang versus left-skewed in Kon Ka Kinh - highlight distinct levels of canopy stratification. Kon Chu Rang exhibits a more uniform vertical structure, balanced competition, and strong regenerative capacity, whereas Kon Ka Kinh is characterized by a well-developed emergent layer and asymmetrical height distribution, reflecting a more advanced successional stage.
Results from the Ripley’s K-function analysis indicate that 12 m represents a critical spatial threshold in the forest structure of dominant species. At smaller scales, such as 5 m, clustering patterns appear fragmented and primarily reflect patches of seedlings; however, when the analysis radius increases to approximately 12 m, a more generalized population structure emerges, clearly revealing the aggregation of adult trees. This outcome is consistent with recent studies on spatial interactions in forest ecosystems and provides insights into ecological mechanisms driven by competition and neighborhood effects. In northern temperate forests, analyses using the point correlation function G(r) have shown that both adults and juveniles of many species cluster strongly within 0 - 8 m, but this aggregation gradually weakens and approaches randomness at larger distances. Species such as Pinus koraiensis, Acer ukurunduense, and Sorbus pohuashanensis exhibit clustering only up to 10 - 14 m [34]. Similar spatial thresholds have been emphasized in tropical forests. For example, in West African rainforests, adult Mansonia altissima tend to repel seedlings within 5 - 12 m and are independently distributed at greater distances [35]. A study of Torreya nucifera communities on Jeju Island, Korea, revealed clear clustering of both male and female adults within 0 - 16 m, while seedlings exhibited even stronger aggregation up to 12 m [36]. Research on the rare conifer Tetracentron sinense in China likewise detected clustering of both seedlings and adults within 0 - 10m, with distributions shifting toward randomness beyond this range [37]. These findings collectively reinforce the view that the biological neighborhood of many forest species typically falls within a spatial scale of 10 - 15 m. For conifers, for instance, seedling aggregation of Larix principis-rupprechtii has been observed within 0 - 5m or 0 - 9m, but distributions become random or uniform at larger distances [37]. Thus, across different forest ecosystems, a spatial threshold of approximately 10 - 12m consistently emerges, corresponding to the extent of root development and the influence zone of an adult tree - where critical biotic interactions take place.
Clustering patterns at scales of 0 - 5m often reflect processes of understorey regeneration or seed dispersal near parent trees. However, as seedlings grow and compete for light and nutrients, weaker individuals are eliminated, while surviving trees gradually shift positions or extend branches to exploit canopy gaps. At distances of around 10 - 12m, numerous studies have documented zones of competition or exclusion, where the root systems and crowns of adult trees extend to cover this area, exerting strong pressure on seedlings or neighboring species [35]. Beyond this range, competitive effects diminish, and the spatial pattern of the population tends to become random or exhibit signs of regularity, reflecting resource partitioning among species or environmental heterogeneity.
The spatial point-pattern analysis using Ripley’s K function revealed clear differences in the spatial organization of woody species within the mixed broadleaf–conifer forest of Kon Chu Rang. Species exhibiting clumped distributions likely reflect adaptation to specific microenvironmental conditions, facilitative interactions, or limited seed dispersal. In contrast, species showing random or regular distributions suggest the influence of competition for light and nutrients and niche differentiation that reduces overlap in resource utilization. These findings provide important ecological insights into the mechanisms of species coexistence within the same community and help explain how mixed forests maintain both high biodiversity and structural stability.
The ecological implications of these results extend to forest conservation and management. Understanding spatial relationships and interspecific interactions enables more accurate predictions of community structural changes under the influence of climate change, resource exploitation, or environmental degradation. Such knowledge can inform management strategies aimed at maintaining ecological niches, species balance, and the functional integrity of mixed forests, thereby supporting long-term biodiversity conservation.
Nevertheless, this study has certain limitations. The use of a single sample plot restricts the generalization of the results to the broader forest landscape, as stand structure may vary significantly with microtopography, soil conditions, and disturbance intensity. Moreover, relying solely on Ripley’s K function captures primarily static spatial patterns, without accounting for dynamic processes such as regeneration, competition, or temporal change. Future research should therefore expand the sampling scale, incorporate complementary spatial and temporal analyses, and conduct long-term monitoring to further elucidate the ecological roles of species and the mechanisms maintaining biodiversity in mixed broadleaf–conifer forests.
V. Conclution
The mixed broadleaf - conifer forest at Kon Chu Rang represents a diverse community in an intermediate successional stage, characterized by balanced species composition, a three-layered canopy dominated by the mid-canopy, and stable height and diameter distributions indicative of both equilibrium and active regeneration.
Ripley’s K-function analysis identified 12 m as the critical spatial threshold for dominant species aggregation. While clustering at 5 m reflects localized seedling patches, the 12 m scale captures both juvenile and adult distributions, corresponding to the biological neighborhood where competitive interactions occur. This underscores the importance of selecting appropriate spatial scales in point-pattern analyses to avoid misinterpretation of clustering intensity. From a management perspective, interventions such as thinning or enrichment planting should consider a neighborhood radius of 10 - 12 m to minimize competition and optimize stand structure. Maintaining natural environmental conditions, limiting disturbances, and promoting the development of large trees while preserving species diversity and natural regeneration will be essential for ensuring long-term ecosystem sustainability.
Acknowledgements: This study was conducted within the framework of the research project: “Research on potential spatial distribution of native plant species for the restoration of tropical forest ecosystems in Gia Lai province” (Code: ST.Đ1.05/24), funded by Joint Vietnam-Russia Tropical Science and Technology Research Center. The authors would like to express their sincere gratitude to the centre for providing financial support, research facilities, and logistical assistance throughout the study.
Author contributions: Dang Hung Cuong: conceptualization, methodology, writing - original draft; Nguyen Dang Hoi: supervision, final approval of the manuscript; Nguyen Thi Kim Thanh: resources, field survey, data collection; Ha Vinh Long and Kieu Duy Hai: data processing, statistical analysis, visualization; Nguyen Van Tu and Nguyen Hong Quan: field investigation, data interpretation. Tran Anh Tuan: critical review, writing - review & editing.
Conflict of interest statement: The authors declare no conflict of interest.
Tài liệu tham khảo
2. N. Strange, S. zu Ermgassen, E. Marshall, J. W. Bull and J. B. Jacobsen, Why it matters how biodiversity is measured in environmental valuation studies compared to conservation science, Biological Conservation, Vol. 292, pp.110546, 2024. DOI: 10.1016/j.biocon.2023.110546
3. Z. Li et al., Environmental response strategies for the spatial distribution of seed plants in Gansu, Front Plant Sci, Vol. 16, 2025. DOI: 10.3389/fpls.2025.1526269
4. R. Chen et al., Spatial Distribution Pattern and Factors Influencing the Endangered Plant Tetracentron sinense Oliv, Forests, Vol.16, No.1, 2025. DOI: 10.3390/f16010159
5. T. Burke, C. S. Rowland, J. D. Whyatt, G. A. Blackburn and J. Abbatt, Spatially targeting national-scale afforestation for multiple ecosystem services, Applied Geography, Vol. 159, pp. 103064, 2023. DOI: 10.1016/j.apgeog.2023.103064
6. S. Keren, Modeling Tree Species Count Data in the Understory and Canopy Layer of Two Mixed Old-Growth Forests in the Dinaric Region, Forests, Vol. 11, No. 5, 2020. DOI: 10.3390/f11050531
7. N. Picard, The role of spatial competitive interactions between trees in shaping forest patterns, Theor Popul Biol, Vol.142, pp. 36-45, 2021. DOI: 10.1016/j.tpb.2021.09.001
8. N. V. Quy, P. T. Ha, N. T. Tuan, and N. V. Hop, Distribution and spatial relationships of tree species in evergreen broadleaf forests in Kon Ka Kinh National Park, Gia Lai province. Can Tho University Journal of Science, vol.58, no.3, pp. 191 - 203, 2022. DOI: 10.22144/ctu.jvn.2022.075
9. C. Hien, H. H. Nguyen, C. LeVan and X. Ruan, Spatial distribution and association patterns of Knema pierrei Warb. and its neighbors in an evergreen broadleaved forest in Con Dao Islands of Vietnam, Appl Ecol Environ Res, Vol. 22, pp. 5213-5235, 2024. DOI: 10.15666/aeer/2206_52135235
10. V. Q. Nguyen et al., Niche And Interspecific Association Of Tree Species In An Evergreen Broadleaved Forest In Dong Nai Culture And Nature Reserve, Vietnam Journal of Forest Sciences- VJFS, No.5, pp. 84-101, 2023.
11. D. A. Dzulhijjah, Kusrini and R. Martinez-Bejar, Comparative Analysis Of Machine Learning Models For Sentinel-2 Based Classification Of The Bornean Heath Forest, Engineering, Technology And Applied Science Research, Vol. 15, No. 2, pp. 2193721943, 2025.
12. P. H. Ho, An illustrated flora of Vietnam. Ho Chi Minh City, Vietnam Youth Publishing House, 1999.
13. H. Tran, Timber Resources in Vietnam. Hanoi, Vietnam, Agricultural Publishing House, 2000.
14. T. B. Nguyen, Flora of Vietnam. Hanoi, Vietnam, Science and Technics Publishing House, 2000.
15. D. Marmillod, Methodology and results of studies on the composition and structure of a terrace forest in Amazonia, Doctoral thesis. Georg-August-Universität Göttingen, 1982.
16. J. T. Curtis and R. P. McIntosh, An Upland Forest Continuum in the Prairie-Forest Border Region of Wisconsin, Ecology, Vol. 32, No. 3, pp. 476-496, 1951. DOI: 10.2307/1931725
17. E. S. R. Valente et al, Estructura, composición florística y diversidad de especies leñosas de un bosque mesófilo de montaña en la Sierra de Manantlán, Jalisco, Boletín de la Sociedad Botánica de México, Vol.73, pp17-34, 2003.
18. B. D. Ripley, The second-order analysis of stationary point processes, J Appl Probab, Vol. 13, No. 2, pp. 255-266, 1976. DOI: 10.2307/3212829
19. B. D. Ripley, Modelling Spatial Patterns, Journal of the Royal Statistical Society: Series B (Methodological), Vol.39, No.2, pp.172-192, 1977.
20. P. W. Richards. The Tropical Rain Forest: An Ecological Study. New York, Cambridge Univ. Press, 1953. DOI:10.1126/science.117.3042.426.A.
21. T. C. Whitmore. An Introduction To Tropical Rain Forests. Oxford University Press, 1998.
22. F. Bongers. Methods To Assess Tropical Rain Forest Canopy Structure: An Overview, Plant Ecol, Vol. 153, No.1/2, pp. 263-277, 2001
23. T. Wiegand, K. A. Moloney. Handbook Of Spatial Point-Pattern Analysis In Ecology. Chapman And Hall/Crc, 2013. doi:10.1201/b16195.
24. C. Oliver, B. Larson. Forest Stand Dynamics. Wiley, 1996.
25. M. H. K. Mounmemi et al., Assessing plant diversity change in logged and unlogged dense semi-deciduous production forest of eastern Cameroon, Heliyon, Vol. 9, No. 5, pp. e16199, 2023. DOI: 10.1016/j.heliyon.2023.e16199
26. E. Alanís-Rodríguez, C. A. Martínez-Adriano, L. Sanchez-Castillo, E. A. Rubio-Camacho and A. Valdecantos, Land abandonment as driver of woody vegetation dynamics in Tamaulipan thornscrub at Northeastern Mexico, PeerJ, Vol.11, pp. e15438, 2023. DOI: 10.7717/peerj.15438
27. Y. She, X. Li, C. Li, P. Yang, Z. Song and J. Zhang, Relationship between Species Diversity and Community Stability in Degraded Alpine Meadows during Bare Patch Succession, Plants, Vol. 12, No. 20, 2023. DOI: 10.3390/plants12203582
28. T. T. T. Huong, N. D. Hoi and T. V. Hung, Differentiation Characteristics Of Mixed Broad, Needle Leaf Forest Type In Bidoup - Nuiba National Park, Journal of Tropical Science and Engineering, Vol.14, pp. 76-87, 2017. DOI: 10.58334/vrtc.jtst.n14.08
29. S. Finnie et al., Vertical stratification and defensive traits of caterpillars against parasitoids in a lowland tropical forest in Cameroon, Oecologia, Vol.204, No. 4, pp. 915-930, 2024. DOI: 10.1007/s00442-024-05542-x
30. C. Hien, H. H. Nguyen, Structure And Tree Species Diversity Of Evergreen Broadleaf Forests After Logging At Kbang District, Gialai Province. Journal of Forestry Science and Technology, Vol.6, pp. 49-60, 2018.
31. D. de Souza Amorim et al., Vertical stratification of insect abundance and species richness in an Amazonian tropical forest, Sci Rep, Vol.12, No.1, pp. 1734, 2022. DOI: 10.1038/s41598-022-05677-y
32. Y. Dessie, N. Amsalu, B. Awoke and G. Gebeyehu, Floral diversity, structural integrity, and regeneration patterns of Endba-Zend dry Afromontane forest in Northwestern Ethiopia, BMC Ecol Evol, Vol.25, No.1, pp. 49, 2025. DOI: 10.1186/s12862-025-02387-7
33. A. B. Mekonnen, W. A. Wassie, H. Ayalew and B. G. Gebreegziabher, Species Composition, Structure, and Regeneration Status of Woody Plants and Anthropogenic Disturbances in Zijje Maryam Church Forest, Ethiopia, Scientifica, Vol. 2022, No. 1, pp. 8607003, 2022. DOI: 10.1155/2022/8607003
34. L. Lin, X. Ren, H. Shimizu, C. Wang and C. Zou, Spatial Patterns and Associations of Tree Species in a Temperate Forest of National Forest Park, Huadian City, Jilin Province, Northeast China, Forests, Vol. 15, No. 4, 2024. DOI: 10.3390/f15040714
35. A. A. Wédjangnon, N. B. Sourou Kuiga, T. Houêtchégnon and C. A. I. N. Ouinsavi, Spatial distribution and interspecific association patterns between Mansonia altissima A. Chev., Ceiba pentandra (L.) Gaertn and Triplochiton scleroxylon K. Schum. in a moist semi deciduous forest, Ann For Sci, Vol. 77, No.1, pp. 6, 2020. DOI: 10.1007/s13595-019-0913-0
36. S. Shin, S. G. Lee and H. Kang, Spatial distribution patterns of old-growth forest of dioecious tree Torreya nucifera in rocky Gotjawal terrain of Jeju Island, South Korea, J Ecol Environ, Vol.41, No. 1, pp. 31, 2017. DOI: 10.1186/s41610-017-0050-3
37. M. Zhang, J. Wang and X. Kang, Spatial distribution pattern of dominant tree species in different disturbance plots in the Changbai Mountain, Sci Rep, Vol.12, No.1, pp. 14161, 2022. DOI: 10.1038/s41598-022-18621-x