AN ECONOMIC EFFICIENCY ANALYSIS OF AQUACULTURE FARMS IN BAI TU LONG BAY IN A 20 - YEAR CYLCLE
University of Science, Vietnam National university, Hanoi
No. 334 Nguyen Trai, Thanh Xuan, Hanoi
Số điện thoại: +84 983656531; Email: duvuvietquan@hus.edu.vn
Nội dung chính của bài viết
Tóm tắt (Abstract)
Aquaculture is one of the main commodity production industries, playing an important role in a coastal country like Vietnam. The objective of this study is to evaluate the economic efficiency of aquaculture farms using cost-benefit analysis (CBA) and sociological survey interviews in Bai Tu Long area. A total of 51 household and aquaculture cooperative questionnaires were used to evaluate the economic efficiency of 4 typical aquaculture farms over a 20-year period. The results showed that the grouper farm had the highest investment capital but the lowest efficiency (B/C = 1.05; Pnpv = 0.01). In contrast, clam, snail and oyster farms have lower investment capital than fish farms but higher efficiency, especially clam farms (B/C = 1.82; Pnpv = 0.47), followed by snail farms (B/C = 1.43; Pnpv = 0.27) and oyster farms (B/C = 1.37 AND Pnpv = 0.19). The analysis results are an important information base providing aquaculture farmers with appropriate adjustments to maximize the benefits of the farms, and policy managers can also make reasonable decisions and recommendations to ensure the sustainable development of the aquaculture industry in the future.
Từ khóa (Keywords)
Cost–benefit analysis (CBA), economic efficiency, aquaculture, Bai Tu Long.
Chi tiết bài viết
- Highlights:
The study used cost-benefit analysis to evaluate the economic efficiency of four types of farming: grouper, clam, oyster, and snail. Indicators such as NPV, B/C, Pnpv, monthly and annual profits were calculated over a period of 20 years, helping to determine the economically optimal farm.
The analysis results show that farms that do not use feed (such as clams, oysters, and snails) have advantages in terms of cost and profit. Grouper farms have the largest investment capital but the lowest economic efficiency (B/C = 1.05; Pnpv = 0.01). In contrast, clam, snail, and oyster farms have lower investment costs but higher economic efficiency, especially clam farming (B/C = 1.82; Pnpv = 0.47).
The study highlights the need to integrate disaster risk, climate change and environmental carrying capacity into future farm economic performance analyses. This firmly supports the goal of developing the aquaculture industry in a sustainable manner, optimizing economic benefits while protecting marine ecosystems.
1. INTRODUCTION
The fisheries sector is integral to the provision of livelihoods and food security for communities, particularly those in coastal regions. Aquaculture is the fastest - growing food production sector in the world [1]. The Food and Agriculture Organization of the United Nations (FAO) estimates that approximately 800 million people worldwide are involved in this sector, including those working directly in aquaculture and those involved in the supply chain and consumption of fishery products [2], [3]. The swift advancement of the aquaculture sector not only meets the growing demand for food but also enhances global food security [4], [5]. Aquaculture industries around the world and in Vietnam are currently facing many challenges, including environmental protection and resource management. Research by Pham Thi Lam et al. (2024) indicates that there is a conflict between economic benefits from aquaculture and environmental protection in coastal communities in Vietnam [6]. Aquaculture can cause adverse environmental impacts, such as the degradation of natural ecosystems and water contamination [7]. Therefore, sustainable development of the fisheries sector is necessary to ensure that economic benefits do not come at the expense of environmental degradation.
In addition to environmental issues, the need for an in-depth understanding of the economic efficiency of aquaculture systems in the current context is also of great concern, and one of the most widely utilized tools worldwide is the cost‒benefit analysis (CBA) method. This is an important tool for assessing the economic efficiency of aquaculture systems, especially in the context of sustainable development in aquaculture areas around the world [8]. The CBA allows managers and investors to evaluate the costs and benefits of aquaculture projects, thereby allowing them to make better-informed decisions about investment and development [8], [9]. Sustainable aquaculture can increase community resilience, especially when it is supported by scientific regulation [10]. These findings suggest that CBA is not simply a financial tool but also a method for promoting sustainable development policies in the aquaculture industry. An important aspect of CBA in aquaculture is the assessment of production costs and benefits. For example, studies have shown that aquaculture systems can yield favourable benefit‒cost ratios. In Bangladesh, commercial fish farming has a benefit‒cost ratio of 1:1.71, indicating that for every unit of money invested, 1.71 units of profit are earned [11]. Similarly, a benefit‒cost ratio of 1.47 was reported for small-scale cage aquaculture in Ghana, suggesting that these systems are economically viable [12]. These findings highlight the potential profitability of aquaculture, provided that production costs are effectively managed.
Economic analysis of aquaculture also extends to the evaluation of specific operations and inputs. For example, optimizing feed expenditures is important, as feed often accounts for a significant portion of total production costs. Research has shown that feed costs can account for up to 73% of the total costs associated with tilapia farming [13]. Therefore, strategies to minimize feed expenditures, such as incorporating plant-based ingredients into aquaculture feeds, can significantly increase profitability [14]. Furthermore, the adoption of good aquaculture practices (GAPs) is associated with increased production and income, thus influencing farmers' willingness to invest in these practices [15]. Furthermore, the integration of different aquaculture systems can lead to improved economic outcomes. For example, offshore integrated multitrophic aquaculture (IMTA) has been shown to enhance environmental sustainability while diversifying economic benefits [16]. This approach allows for the simultaneous farming of different species, which can mitigate risk and enhance overall profitability.
In addition to production activities, external factors, including market conditions and environmental policies, also play important roles in the economic performance of aquaculture. For example, the COVID-19 pandemic has significantly impacted aquaculture operations, requiring a reevaluation of financial strategies to maintain profitability [17]. Furthermore, the use of Geographic Information Systems (GIS) in aquaculture site selection can optimize the allocation of resources and enhance economic outcomes by identifying the optimal locations for production [18]. In summary, cost‒benefit analysis in aquaculture involves various aspects, such as production costs, feed optimization, system integration, and market externalities. The evidence suggests that with careful management and strategic planning, aquaculture can be a profitable business, contributing to food security and economic development.
Bai Tu Long Bay has high biodiversity value and extremely unique landscapes. The ecosystems in the Bai Tu Long Bay area all have their own characteristics arising from natural and human conditions, with values and orientations that propose their own exploitation, management and protection measures. The interweaving of floating islands and sea channels located in sheltered bays and coves creates extremely favourable natural conditions for the development of the aquaculture industry. In recent years, the area and output of aquaculture have increased along with activities related to the production, processing and consumption of aquatic products. According to the report of Van Don District in 2023, the aquaculture industry continues to be the spearhead economic sector, the strength of the district (accounting for 88.7% of the total structure of the agricultural sector), and the production value in 2023 reached 2,270.805 billion VND. In particular, aquaculture continues to receive investment attention for development and expansion of production, diversification of valuable and economically efficient farming objects, especially mollusc and cage fish farming; the productivity and quality of farming products are improved, the current farming area is 3,343 hectares (reaching 237 hectares compared with 2021), the aquaculture output has reached 61,936 tons (reaching 27,227 tons/year compared with 2021), and the production value of the aquaculture industry has reached 1,791.5 billion VND. Four enterprises, 4 cooperatives, and 10 households are attracted to invest in production and aquaculture; 8 business units, 62 cooperatives and over 1,174 households participate in investing in aquaculture production in the district, creating jobs for more than 7,500 local workers. The gradual formation of concentrated farming areas gradually shifted from unplanned rampant farming to large-scale, concentrated farming systems, converting farming materials to ensure environmental friendliness. A total of 100% of the marine aquaculture systems in the area are maintained to carry out organic production.
On the basis of the current status of aquaculture development in the Bai Tu Long Bay area, this study used the CBA method to evaluate the economic efficiency of aquaculture farms through evaluation indicators such as the net present value (NPV), benefit‒cost ratio (B/C), net profit‒ total cost ratio (Pnpv), monthly profit (Bm), and annual profit (By) achieved in a 20-year cycle with the aim of analysing the economic efficiency of aquaculture types, thereby finding the most effective aquaculture production farm. The results of this study provide a reference information base for managers, households, and aquaculture cooperatives to make appropriate and reasonable decisions and adjustments to maximize the economic benefits of farms while ensuring the sustainable development of the local aquaculture industry in the future.
2. MATERIALS AND METHODS
2.1. Study area
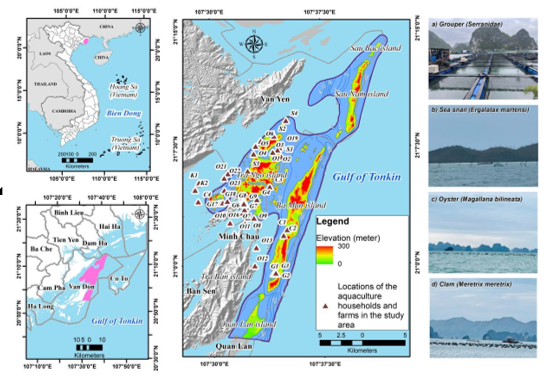
Figure 1. Map of the study area in Bai Tu Long Bay ((i) Study area boundary (sourced from the Department of Survey and Mapping Vietnam); (ii) images and locations of the aquaculture households and farms (sourced from the author group))
This study conducted a sociological survey and investigation of 51 aquaculture households and farms in the waters of Bai Tu Long Bay in November 2024 (Figure 1). The survey points were spread around the islands of Ba Mun, Sau Nam, Sau Bac, Tra Ngo, and northern Quan Lan Island.
2.2. Methodology
2.2.1. Sociological methods
The sociological survey research method is a flexible and versatile tool, allowing effective approaches to diverse and complex issues. This method, which is based on the principle of social interaction, directly affects participants' perceptions through interviews or prepared questionnaires [19].
In November 2024, the research team conducted a field survey using sociological survey methods in the Bai Tu Long Bay area, focusing on aquaculture activities. The objective of the sociological survey in this study was to collect basic information on aquaculture activities, including location, scale of aquaculture, characteristics of aquaculture species, investment and operating costs, and economic efficiency for local people. In addition, the survey investigated aquaculture experiences, difficulties, and challenges that local people face in the profession. Primary data were collected through direct interviews with 51 typical households in the study area via a detailed questionnaire. These households were selected based on criteria such as aquaculture location, aquaculture species, production methods and scale, and the level of investment in equipment. The collected information includes aquaculture technical characteristics, financial costs, and production efficiency according to the actual assessment of people at each farm.
The principle of representative sampling was applied to extrapolate the survey results from a small part to the entire community. An analysis of the survey data revealed that the collected data comprehensively reflected the production characteristics of the aquaculture households in this area and provided a basis for a detailed assessment of the research activities.
The study surveyed aquaculture households according to a system of questions to determine the following information:
(1) General information about the farming household (full name, hometown, age, education level, etc.);
(2) Information on farming techniques: farm type, farming method, type of farming water surface, area, aquaculture area, and number of family workers participating in aquaculture activities. Seed cost, quantity, stocking density, feeding cost, farming time, farm size, medicine, and farm survival rate;
(3) Information on financial costs: The input costs of the farm are calculated on average per m², farm operating costs, farm production outputs, and farm revenues.
(4) Farmers' assessment during the farming process of the advantages and difficulties of the farm being implemented.
After being reviewed and rechecked, the information will be analysed for cost‒benefit analysis of the farming systems, from which the research team can calculate and compare the economic efficiency of aquaculture types to assess the production efficiency of the farming systems. The possibility of applying and replicating aquaculture farms at sea should be evaluated.
2.2.2. Cost–benefit analysis method (CBA)
In this study, 4 farm types, oysters, groupers, clams, and snails, were included in the cost‒benefit analysis according to the following steps:
Step 1: Establishing a 20-year life cycle CBA assessment framework for farm types
In this step, the authors determined the CBA analysis approach from cost components such as direct and indirect investment costs and benefit components such as economic efficiency, price, and productivity. In addition, impacts from geographical factors such as natural disasters and biodiversity were also identified in the CBA assessment framework.
Step 2: Determine the costs and benefits of classification
The categories include initial basic investment costs (C1), i.e., cage installation costs; farm operating costs (actual costs) (C2), i.e., labor costs, seed costs, feeding costs, boat purchases, electricity and water costs; and financial costs (regular costs) (C3), i.e., initial loans to invest in the farm.
Step 3: Select typical farms for analysis
In this study, the authors selected 4 farm types: grouper farming, sea snail farming, oyster farming, and clam farming. The quantifiable factors affecting the farming systems were then determined for inclusion in the analysis. The results are shown in Table 1 below:
The grouper cultivated in Bai Tu Long Bay is seminaturally raised in cages and rafts. The cage and raft system is made from light materials such as wood, 200-liter plastic drums, and nets with dimensions of 4x4x3.5 m. These cages are connected to form rafts of 8–300 cages, the cages are placed in places with gentle currents, and the minimum depth is 5–6 m (compared with the tide level). From April to June, grouper fingerlings were released into different cages. Each cage has a volume of 4 m × 4 m × 3.5 m and can hold 500 to 555 grouper fingerlings ranging from 10 cm to 15 cm in length. With the Grouper farm of aquaculture cooperatives and companies with large capital, feeding with proper farming techniques is performed twice a day, the food is other small fish species with market prices ranging from 8–11 thousand VND/kg, and the total weight of food is from 5–10% of the total weight of the grouper. The cage net was changed and repaired every 2 months. The farming cycle is approximately 22–24 months/crop, and the finished fish weighs from 2.5–3 kg/fish, with a survival rate of over 95%. For small-scale farming households with 6–12 cages and small capital, fish are fed 1–2 times a week, and there is no specific amount of food. The farming cycle is 3–5 years/crop. Commercial fish are not sold at the same time, but according to the needs of the households.
The sea Snail farm is natural. Households following this farm have to pay only the initial basic investment costs, such as boats for transportation, nets, and bamboo poles, and do not have to pay intermediate feeding costs. The farming area is calculated according to the length of the island coastline and from the shore to 5–8 m of water. The bamboo poles and nets were placed 1–1.5 m above the water surface and buried more than 10 cm deep so that the sea snails did not escape. Sea snail seeds are released every year, and 1 ton of sea snail seeds is released every 1 km along the coastline. The cycle of raising finished sea snails is 12 months, and the nets and bamboo poles have a durability of 2–3 years. The farm for raising oysters with buoys is made from light and durable materials; each fixed rope is 200–250 m long, 10 ropes have an area of approximately 1.2 hectares, and each rope hangs oysters 1 m deep into the water. Oyster seeds are released every year from June to August. Oyster lines should be placed in water areas with gentle currents and suitable physical and chemical indicators of water, especially in places with high plankton levels. Depending on the farming location, the harvest cycle of naturally farmed oysters in Bai Tu Long Bay will last from 6 - 12 months, the average yield rate will range from 70% to 90%, and the initial investment facilities will have a lifespan of over 10 years.
Table 1. Characteristics of the farm types in Bai Tu Long Bay
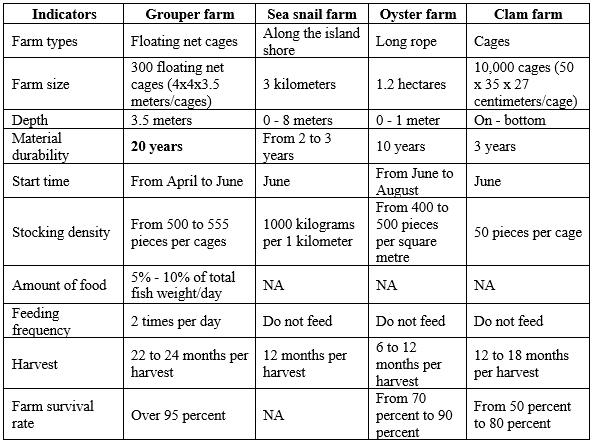
(NA: not available; Source: Author Group)
Natural clam farming is not based on area but rather on the number of cages; clam cages are released to the seabed in places with high plankton density, each cage contains approximately 50 seeds, and the durability of the cage is 3 years, with replacement from the beginning. The harvest cycle will last 12 - 18 months, and the clamfarming survival rate will reach an average of 50% - 80% of the initial number of seeds.
Step 4: Calculate the costs and benefits in the 20-year life cycle of the farms
The calculated indicators are categorized into two groups: i) indicators reflecting results and ii) indicators reflecting efficiency, specifically:
Group of indicators reflecting the results:
The total output (TO) is the value of aquatic production calculated as the total result of production activities in the 20-year cycle according to market prices at the time of survey.

where Pt: Farm productivity at crop t
m: Number of crops in the calculation period
α: Farm efficiency at the time of survey
The total cost (TC) is the total cost paid in the 20-year cycle at the market price at the time of survey:

where C1: Initial basic investment cost
C2: farm operating cost
C3: Initial loan cost to invest in the farm
Group of indicators reflecting efficiency:
Net present value (NPV) is the value of expected cash flows discounted to the present time; it reflects the profit earned from the initial investment:
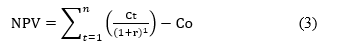
where Ct: Net cash flow of the project in year t
Co: Initial cost of implementing the farm
t: Year of calculating cash flow
n: Time at which the farm was implemented
r: Cash flow discount rate
The benefit‒cost ratio (B/C) is an index used to analyse the benefit‒cost relationship between the total relative costs and certain benefits of a farm.
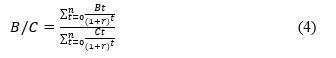
where Bt: farm income in year t
Ct: farm cost in year t
r: Cash flow discount rate
n: farm implementation time
Net profit margin on total cost
where Pnpv: Net profit margin on total cost
NPV: Net present value
TC: Total cost of the cycle
The profit margin per month is an index reflecting the average monthly profit in the cycle of the farms.
where Pm: Monthly profit rate
NPV: Net present value
n: Number of years of the cycle
The annual return is an index that reflects the average annual profit in the farm's cycle
where Py: Annual profit rate
NPV: Net present value
n: Number of years of the cycle
Step 5: Select the cash flow discount rate and cycle, calculate, and compare the results of the indicators reflecting the results and efficiency of the farms to provide a general picture of the relationship between the costs and benefits of the farms.
In this study, the authors chose a cash flow discount rate of 6%/year, corresponding to the average interest rate of banks lending for the purpose of developing agriculture, forestry, and fishery; the cycle is 20 years because aquaculture is a specific industry, and different species have different growth and development times. In addition, aquaculture systems in Vietnam were developed according to long-term goals. From there, the efficiency indicators of each specific farm are calculated.
Step 6: Analyse the results and make comments and recommendations on the farms.
3. RESULTS
3.1. Characteristics of aquaculture systems
Figure 2 below shows the number of aquaculture households and farms surveyed in Bai Tu Long Bay in 2024. In terms of the 51 households and farms surveyed, the oyster aquaculture type accounted for the majority, with 23 farms, followed closely by the grouper aquaculture type, with 18 farms. The sea snail aquaculture type and clam aquaculture type were equal, with 4 farms each. The two farms with sea snails and the other farms had the lowest number of farms, with 4 and 3 farms, respectively.
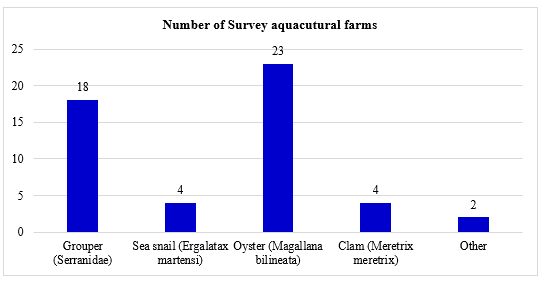
Figure 2. The number of aquaculture households and farms surveyed in Bai Tu Long Bay, Quang Ninh Province
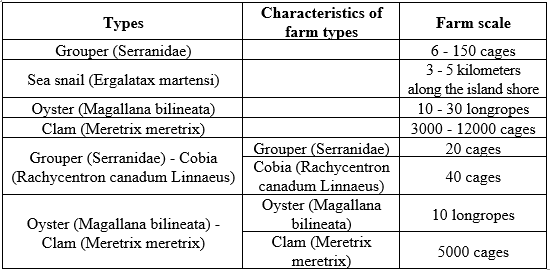
The scale of the aquaculture types surveyed in the Bai Tu Long Bay area is shown in Table 2 below. Accordingly, 18 grouper farms have a scale of 6-150 cages, 4 shore snail farms have a scale of 3-5 km of coastline, 23 oyster farms have a scale of 10-30 oyster lines, and 4 clam farms have a scale of 3,000 - 12,000 cages. In addition, there are 2 farms of combined Grouper - Cobia farming with a total scale of 60 cages, and a farm of combined oyster farming (10 lines), Clam farming (5,000 cages).
Table 2. The characteristics of the farm types surveyed in Bai Tu Long Bay, Quang Ninh Province
3.2. Results and effectiveness of typical aquaculture systems
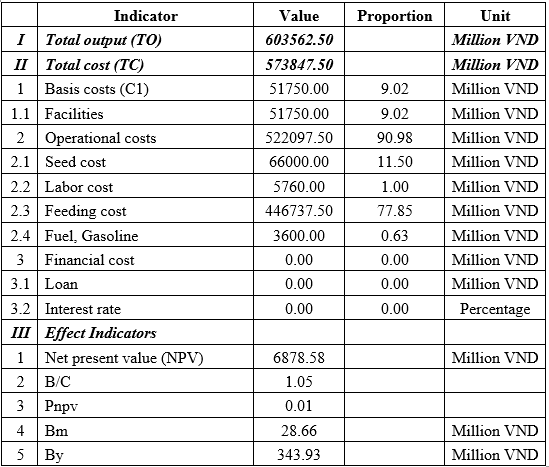
The results of the cost‒benefit analysis of the 300-cage farm for commercial grouper farming over 20 years show that the feed cost accounts for the largest proportion of the total cost of grouper farming, with 446,737.5 million VND (77.85%), followed by the cost of fish seeds and the investment in cages, with 66,000 million VND (11.5%) and 51,750 million VND (9.02%), respectively. Expenses such as gasoline, oil, and labor costs account for a very small proportion of the total operating cost of this farm: 3,600 million VND (0.63%) and 5,760 million VND (1%), respectively. This farm costs a large initial investment, and to operate, the investor must have a very large capital source with a total cost of 573,847.5 million VND.
Table 3. Economic efficiency of a grouper farm in Bai Tu Long Bay over 20 years
(Source: Author group)
The 20-year net present value (NPV) of Grouper farming is 6,878.58 million VND, indicating that this is a profitable farm in the future. After discounting and deducting the total investment, the income that this farm brings is on average 28.66 million VND/month and 343.93 million VND/year. The B/C ratio is 1.05, indicating that this farm is feasible for investment and profitable. The net profit ratio on total cost (PnPv) is 0.01, showing that each dollar of initial investment will generate an additional 1% profit after discounting. This shows that, among the 4 farms included in the analysis, farming is the most difficult way to recover capital. This farm requires a very large initial investment, and it takes 4 years (2 crops) to recover capital and make a profit. However, the profit stream must be reinvested in the farm in the following crops to continue operating the farm.
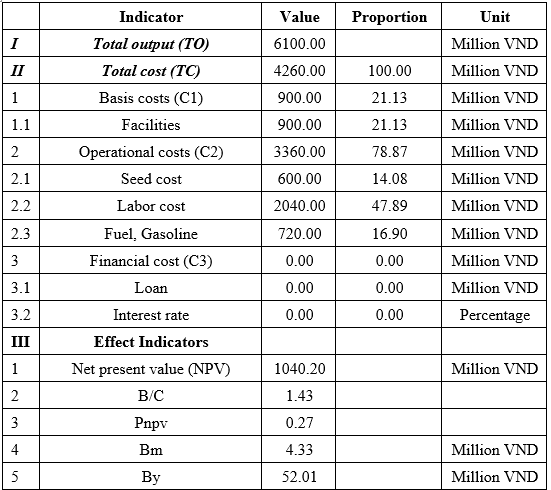
Table 4. Economic efficiency of sea snail farms in Bai Tu Long Bay over 20 years
(Source: Author group)
The results of the cost‒benefit analysis (CBA) of the 20-year life cycle of the sea snail farm (Table 3) show that this farm has the lowest initial investment cost among the 4 farms, with a total cost of 4,260 million VND in 20 years. The highest cost is the labor cost, with 2,040 million VND (accounting for 47.89%), and the facility cost, with 900 million VND (21.13%). The smallest cost is the same cost, with 600 million VND (accounting for 14.08%). The B/C ratio is 1.43, and the net profit margin (Pnpv) is 0.27, proving that this farm is feasible and worth investing in and that each initial investment will generate a profit after a discount of 27%. The net present value (NPV) is 1,040.2 million VND, and each sea snail farm will receive 4.33 million VND/month and 52.01 million VND/year after the discount.
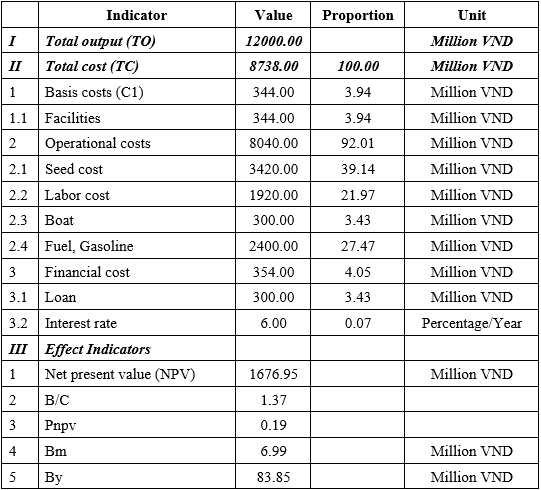
Table 5. Economic efficiency of an oyster farm in Bai Tu Long Bay over 20 years
(Source: Author group)
Table 5 shows the results of the cost‒benefit analysis of oyster farming (1.2 ha) with a 20-year cycle. The cost with a high proportion is seed cost, with 3,420 million VND (accounting for 39.14%), and fuel and gasoline cost of 2,400 million VND (27.47%), followed by labor cost of 1,920 million VND (21.97%) and infrastructure cost of 344 million VND (3.94%). The lowest cost is the loan and the loan interest rate for 5 years, accounting for 3.43% and 0.07% of the total cost, respectively. Oyster farming has a very high B/C ratio of 1.37, corresponding to a net interest rate (PnPv) of 0.19. This shows that each dollar invested in oyster farming will result in an additional 37% pre-discount profit and 19% post-discount profit. The corresponding net profit (NPV) of oyster farming is 1,676.95 million VND. Each oyster farming household will have a corresponding income of 6.99 million VND/month, 83.85 million VND/year.
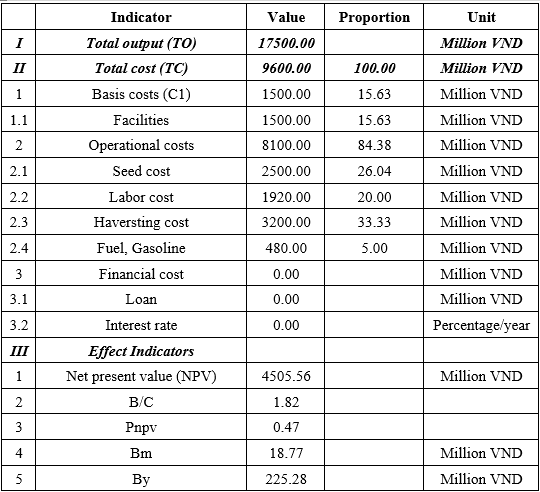
Table 6. Economic efficiency of a clam farm in Bai Tu Long Bay over 20 years
(Source: Author group)
Results on the efficiency of clam farming (10,000 cages) Table 6:
Clam farms depend mainly on natural food sources, and the cost accounting for a large proportion is the cost of labor for harvesting, seed cost, and labor cost, with 3,200 million VND (accounting for 33.33%), 2,500 million VND (accounting for 26.04%), and 1,920 million VND (accounting for 20%), respectively. The efficiency indicators of this clam farming farm (10,000 cages) reveal the excellent performance of the farm; this farm has a very high B/C ratio of 1.82, corresponding to a net interest rate (PnPv) of 0.47. This shows that this farm results in enormous profits, and each capital invested in the oyster farming farm will result in an additional 82% before the discount and 47% after the discount. The corresponding net interest rate of the farm is 4,505.56 million VND. Each clam farming household following this farm is expected to receive 18.77 million VND/month and 225.28 million VND/year, which is the farm with the highest profit among all 4 farms.
4. DISCUSSION
The research results show that the Grouper farm has the highest NPV among the analysed farms. However, the economic efficiency indices, such as the benefit‒cost ratio (B/C) and Pnpv index, are the lowest, at 1.05 and 0.01, respectively. The main reason is the very high initial operating costs, especially the feeding cost. The profits earned after each crop must be reinvested immediately in the next crop, and it takes at least two crops to recover capital. Although the farming efficiency reaches 95%, to optimize this farm, a more reasonable feed cost control strategy is needed. In the case of borrowing, the interest rate needs to be maintained below 6% in the first 4 years to ensure the ability to recover capital. In contrast, clam, snail, and oyster farms show outstanding economic efficiency. The clam farm achieved B/C = 1.82 and Pnpv = 0.47; the sea snail farm achieved B/C = 1.43 and Pnpv = 0.27; and the oyster farm achieved B/C = 1.37 and Pnpv = 0.19. One of the main reasons is that these farms do not incur feed costs because they are completely dependent on natural food sources. However, to maintain high efficiency, it is necessary to choose a suitable farming location (flow, plankton quantity, water quality) and apply precise farming techniques (breed selection, stocking density).
A comparison of the above results with other research results from around the world and Vietnam reveals that the economic efficiency of the fish farm in Bai Tu Long Bay has a lower B/C ratio than that of the fish farms in India, with a B/C ratio of 1.22, in Karala 2.02, and in Tamiladu 1.22. In Vietnam, the economic efficiency differs across regions. Research by Bui Van Quang et al. (2023) revealed that a shrimp farm combined with a snail farm in Quang Ngai has a total cost of 249 million VND/ha, whereas a snail farm on Phu Quoc Island only costs 40.1 million VND/100 m²/crop [20]. However, the NPV in Phu Quoc was only 0.68 times greater than the 1.05 times greater than that in Bai Tu Long Bay and 2.01 times greater than that in Quang Ngai [21]. These findings emphasize the importance of conducting cost‒benefit analyses to assess the feasibility and sustainability of coastal aquaculture projects. Moreover, they reported that the economic efficiency of aquaculture farms in Vietnam depends largely on natural conditions, farming techniques, and financial strategies.
Within the framework of this paper, the authors identify groups of factors affecting the value of 4 typical aquaculture farms in Bai Tu Long Bay related to the cost group (basic investment, operation, loan) and the group of economic efficiency indicators (productivity, market price, market discount) to be analysed and initially determine the economic efficiency of these farms. However, this study takes 20 years, which is quite a long time, and CBA cannot fully calculate the issues of inflation, interest rates, and different cash flows that are included in actual farms in the future, but only uses all factors related to the value of cash flows at present. For example, for oyster farms, the investor has a loan of 300 million VND with an interest rate of 6%/year and a loan for 5 years. Assuming that after 5 years, the investor has not paid the principal, the interest rate at that time may be different, and at this time, the difference between costs and benefits will be different, and the efficiency of the farm will be different. Environmental issues such as temperature, flow, and natural disasters are also issues that need to be noted on farms. Changes in these factors can affect the productivity of species. In addition, plankton density is a very important factor in the farming of some species, such as oysters, snails, and clams. Places with high plankton density can farm at high density and increase productivity, and vice versa.
To optimize the costs and benefits of aquaculture farms, it is necessary to assess and forecast the changes in the above natural factors affecting the aquaculture activities of each species. Natural disaster risk factors such as climate change, storms, and water pollution will also be recorded and included in future analysis farms to provide the best aquaculture solutions. From there, an overview of the aquaculture conditions in the Bai Tu Long Bay area will be obtained, and aquaculture farms of different species will be allocated to the most suitable locations. In addition, it is necessary to continue studying the environmental carrying capacity to maximize the efficiency and benefits of aquaculture activities towards the goal of sustainable economic development.
5. CONCLUSION
This study uses the cost‒benefit analysis (CBA) method to identify the economic efficiency indicators of 4 typical aquaculture farms in a 20-year cycle in the Bai Tu Long Bay area. The results show that the Clam farm has the highest economic efficiency, with a B/C ratio of 1.82 and a Pnpv of 0.47, followed by the Sea Snail farm, with a B/C ratio of 1.43; the Pnpv is 0.27, and the Oyster farm, with a B/C ratio of 1.37; and the Pnpv is 0.19. The Grouper farm has the lowest economic efficiency, with a B/C ratio of 1.05 and a Pnpv of 0.01. From there, an overview of the aquaculture conditions in the Bai Tu Long Bay area is given, with farms of different species allocated to the most suitable locations for each species. This is an important basis for households and agricultural cooperatives to adjust costs to maximize the economic efficiency of the farm, and managers can refer to it to select and identify key economic aquaculture farms for the sustainable development of the region's marine economy.
6. RECOMMANDATION
In the future, to optimize the costs and benefits of aquaculture farms, risk factors for natural disasters such as climate change, storms, and water pollution need to be included in the analysis of farms to provide the most accurate results. In addition, the issue of regional environmental capacity is also considered and evaluated to maximize the efficiency and benefits of aquaculture activities towards the goal of sustainable economic development.
Acknowledgements: This study was completed on the basis of a database on the topic "Research on assessing ecosystem services for biodiversity conservation and rational use of natural resources in Bai Tu Long National Park, Quang Ninh Province" chaired by the Institute of Tropical Ecology, Joint Vietnam-Russia Tropical Science and Technology Research Center.
Authorship contribution statement: Viet Thanh Pham: Writing – original draft, Writing - review & editing, Visualization, Validation, Methodology, Formal analysis, Data curation, Funding acquisition, Conceptualization. Quan Vu Viet Du: Writing - original draft, Writing - review & editing. Hien Thi Thuy Nguyen: Data curation. Ngoc Thi Dang: Methodology, Data curation. Tu Anh Dinh Vu: Methodology. Dung Trung Ngo: Writing - original draft, Methodology. Truong Van Tran: Methodology, Writing - review & editing.
Declaration of Competing Interest: The authors declare no conflict of interest.
Tài liệu tham khảo
2. L. Marques, R. Calado and A. I. Lillebø, Potential of ascidians as extractive species and their added value in marine integrated multitrophic aquaculture systems–From pests to valuable blue bioresources, Front. Mar. Sci., Vol. 9, p. 849870, 2022. DOI: 10.3389/FMARS.2022.849870
3. R. Namitha, R. Vasantharaja, M. Radhakrishnan and K. Govindaraju, Actinobacteria and their bioactive molecules for anti‐WSSV activity: A mini review, Aquac. Res., Vol. 52, no. 3, pp. 883-889, 2021. DOI: 10.1111/are.14942
4. J. A. Gephart et al., Scenarios for global aquaculture and its role in human nutrition, Rev. Fish. Sci. Aquac., Vol. 29, number 1, pp. 122-138, 2020. DOI: 10.1080/23308249.2020.1782342
5. M. Troell et al., Does aquaculture add resilience to the global food system?, Proc. Natl. Acad. Sci., Vol. 111, No. 37, pp. 13257-13263, 2014. DOI: 10.1073/pnas.1404067111
6. Pham Thi Lam, Tran Dinh Thao, Conflicts between aquaculture and environmental protection in coastal communities in Vietnam, Journal of economics and development, No. 318,(2), pp. 2029, 2023.
7. Luong Cong Trung, Aquaculture: Environmental impact and towards sustainability, Journal of aquaculture science and technology, Nha Trang University, No. 04, pp. 137-154, 2023.
8. N. Samat, K. H. Goh and K. F. See, Review of the application of cost–benefit analysis to the development of production systems in aquaculture, Aquaculture, pp. 740816, 2024. DOI: 10.1016/j.aquaculture.2024.740816
9. B. M. Dreyer, B. H. Nøstvold, K. Ø. Midling and Ø. Hermansen, Capture-based aquaculture of cod, FAO Food Agric. Organ. U. N. Fish. Tech. Pap., Vol. 508, pp. 183-198, 2008.
10. C. R. Engle, J. van Senten, Resilience of communities and sustainable aquaculture: governance and regulatory effects, Fishes, Vol 7., No. 5, p. 268, 2022.
11. Siddiqa, M. Shahroz, B. Barman, M. Ahmed and B. Chakraborty, Production economics and profitability analysis of aquaculture in Southwest Bangladesh, Int. J. Oceanogr. Aquac., Vol 2, No. 6, p. 000156, 2018. DOI: 10.3390/fishes7050268
12. E. K. Magna, E. T.-D. Mensah, F. N. Mabe, M. Johnson-Ashun, L. O. Konadu and E. K. Appiah, Profitability analysis of small‐scale cage aquaculture farms in the Volta Lake of Ghana, Aquac. Res., Vol. 2023, No. 1, pp. 1314660, 2023. DOI: 10.1155/2023/1314660
13. P. D. Kulyakwave, K. E. Ngondo, The novel factors for profitability and viability for ponds’ Tilapia farming in coastal region of Tanzania, J. Econ. Manag. Trade, Vol. 26, No. 7, pages. 70-76, 2020. DOI: 10.9734/jemt/2020/v26i730276
14. J. E. Omeje, A. I. Achike, G. O. Nwabeze, L. M. O. Ibiyo and S. P. Jimmy, Economic analysis of locally produced aquaculture feeds with complements of plant-based ingredients in Kainji Lake Basin, Nigeria, Res. World Agric. Econ., Vol. 4, issue 1, pp. 54-61, 2023. DOI: 10.22004/ag.econ.333518
15. T. Tarunamulia, E. Ratnawati, K. Kamariah, R. Asaf and A. Athirah, Factor affecting the willingness to adopt good aquaculture practices (GAPs) in traditional shrimp farming in Pinrang Regency, South Sulawesi Province, Indonesia, in BIO Web of Conferences, EDP Sciences, 2023, p. 06003. DOI: 10.1051/bioconf/20237406003
16. T. Chopin, J. A. Cooper, G. Reid, S. Cross and C. Moore, Open-water integrated multi-trophic aquaculture: environmental biomitigation and economic diversification of fed aquaculture by extractive aquaculture, Rev. Aquac., Vol. 4, p.h 4, pp. 209-220, 2012. DOI: 10.1111/j.1753-5131.2012.01074.x
17. E. Sercan, Financial and economic impacts of the COVID-19 pandemic on aquaculture in Türkiye and financial policy recommendations, Mar. Policy, Vol. 146, p. 105313, 2022. DOI: 10.1016/j.marpol.2022.105313
18. V. Stelzenmüller, A. Gimpel, M. Gopnik and K. Gee, Aquaculture site-selection and marine spatial planning: the roles of GIS-based tools and models in Aquac. Perspect. Multi-Use Sites Open Ocean Untapped Potential Mar. Resour. Anthr., 2017, pp 131-148.
19. R. K. Sharma, Sociological methods and techniques. Atlantic Publishers & Dist, 1997.
20. Ngo Van Ut, Nguyen Thi Hong Diep, Vu Ngoc Ut, Truong Hoang Minh and Tran Hoang Tuan, Current environmental - technical and financial status of snail farming (babylonia areolata link, 1807) in Phu Quoc island, Kien Giang province, Can Tho University Journal of Science, No. 25, pp. 231-238, 2013
21. Bui Van Quang, Nguyen Ngoc Mai, Hoang Thi Kim Anh and Nguyen Anh Tuan, Economic efficiency of nearshore aquaculture models in Quang Ngai province, Vietnam, Journal of Economics and Development, pp. 110-119, 2024. DOI: 10.33301/JED.VI.1344