CHARACTERIZING AEROSOL PARTICULATE MATTER IN BIEN HOA CITY, DONG NAI PROVINCE: MASS CONCENTRATION LEVELS, RATIOS, AND LONG-RANGE TRANSPORT BY HYSPLIT MODEL
Joint Vietnam - Russia Tropical Science and Technology Research Center - 63 Nguyen Van Huyen, Nghia Do, Hanoi, Vietnam
63 Nguyen Van Huyen, Nghia Do, Hanoi, Vietnam
Phone: +84 982203883; Email: tuandioxin@gmail.com
Main Article Content
Abstract
Bien Hoa City, Dong Nai province, is showing signs of increasing pollution. In this study, aerosol particulate matter - PM samples (including TSP, PM10, PM2.5) were collected uniformly (same time, same location, same 24-hour period) on specialized sampling paper using high volume air samplers (HVAS, Tisch Environment, Inc.) for the first time. PM samples were quantified using a Mettler Toledo XS205 weight scale and source apportionment was traced using the backward trajectory analysis model HYSPLIT. The results showed that the mass concentrations of TSP, PM10, PM2.5 during the dry season (2023) were 97.4 ± 11.4 µg/m³, 64.4 ± 7.9 µg/m³, 49.89 ± 7.2 µg/m³ respectively; and during the wet season (2023) were 71.5 ± 10.3 µg/m³, 51.4 ± 8.7 µg/m³, 36.8 ± 7.5 µg/m³ respectively. The concentrations of PM10 and PM2.5 exceeded the recommended values of the World Health Organization (WHO), especially PM2.5 which exceeded both the WHO guidelines and the national limit of QCVN 05:2023/BTNMT. The distribution of fine particulate matter PM₂.₅ shows a significant dominance in the overall particulate composition, accounting for approximately 52-78% depending on the season. The HYSPLIT backward trajectory analysis suggests that distant sources may influence air quality in the study area; however, this observation requires further verification due to the limited sample size.
Keywords
Air pollution, particulate matter ratio, TSP, PM10, PM2.5, HYSPLIT, Bien Hoa City.
Article Details
- Highlights:
First-time synchronized sampling of TSP, PM10, and PM2.5 in Bien Hoa City using standardized international methods, ensuring high accuracy and reliability.
PM10 and especially PM2.5 concentrations exceeded both WHO guidelines and Vietnam’s QCVN 05:2023/BTNMT standards, indicating severe air pollution issues.
Fine particulate matter (PM2.5) dominated the aerosol composition (52-78%) and backward trajectory analysis (HYSPLIT) confirmed significant impacts from long-range transported pollution sources.
1. INTRODUCTION
Air pollution is a global environmental issue that has been and continues to occur across most countries, particularly in major urban areas worldwide. According to the report of World Health Organization (WHO), approximately 99% of the global population is exposed to air that exceeds WHO's recommended pollution levels, with both indoor and outdoor air pollution contributing to around 7 million deaths annually [1].Air pollution is projected to become the leading cause of mortality due to environmental pollution worldwide by 2050 [2].
In the context of air pollution, particulate matters (PMs) in the atmosphere is considered one of the most significant threats to the deterioration of air quality and human health [3, 4]. PM, or aerosols, can be classified in various ways based on their characteristics, such as size, morphology, formation mechanisms, and physicochemical composition. Among these, the most common classification is based on particle size [5].Total Suspended Particulates (TSP) refers to all particles with a diameter of up to 50 μm that can remain suspended in the atmosphere for a significant period of time [6].For smaller particle sizes, they are often labeled with a number representing their aerodynamic diameter. For example, PM10 (respirable particulate matter) and PM2.5 (fine particulate matter) refer to particles with an aerodynamic diameter of 10 μm or less, and 2.5 μm or less, respectively [7]. Particles with an aerodynamic diameter ranging from 2.5 to 10 μm are referred to as coarse particulate matter, denoted as PM2.5 - PM10[8]. The sources of PM can be classified into natural sources (such as sandstorms, volcanic eruptions, pollen, sea spray, etc.), anthropogenic sources (including transportation activities, industrial processes, agriculture, and artisanal production), and secondary sources, where particles are formed through various complex biogeochemical and physical processes in the atmosphere [6, 8, 9]. Air pollution with high levels of PM can lead to significant adverse impacts on public health, environmental quality, biological productivity, infrastructure, and climate change. On one hand, it contributes to reduced visibility, deposition that leads to acid rain, and directly affects the climate by scattering and absorbing solar radiation, or indirectly by providing cloud condensation nuclei for cloud droplets. On the other hand, both short-term and long-term exposure to PM increases the incidence of respiratory and cardiovascular diseases, leading to higher mortality rates in humans [1].
In response to the concerns outlined above, governments and scientists worldwide have made efforts to develop plans and strategies to control and mitigate the adverse impacts of air pollution. In Vietnam, the Ministry of Natural Resources and Environment (MONRE) has also mobilized resources and identified key priorities in implementing solutions to address the growing issue of air pollution, which has been worsening in recent years [17]. In addition to regions with severe air pollution, such as Hanoi and Ho Chi Minh City (HCMC), Bien Hoa City (BHC) in Dong Nai Province has recently emerged as a hotspot for air pollution [11, 12, 13]. However, these studies focused primarily on sampling and analyzing the characteristics of fine particulate matter (PM2.5) during the rainy season of 2021 and the dry season of 2022. Le et al. (2024) analyzed the surface morphology and particle size distribution of PM2.5. These studies, however, did not address the distribution ratios of suspended PM in the air with varying particle sizes, ranging from larger particles such as TSP, to PM10, and fine dust (PM2.5). The particle size characteristics of PM play a crucial role in its potential hazards to both health and the environment [9, 13]. Smaller particles have the ability to travel greater distances, remain in the atmosphere for longer periods, and possess a larger total surface area, which provides favorable conditions for physical and chemical interactions. These particles also have a greater potential to penetrate deeper into the human respiratory system [6, 13, 14]. To better understand the issue of air pollution in BHC, the concentration and particle size distribution of PM (including TSP, PM10, and PM2.5) were monitored and evaluated during both the rainy and dry seasons of 2023. Additionally, the trajectory of PM pollution sources was investigated using the Hybrid Single-Particle Lagrangian Integrated Trajectory (HYSPLIT) model. This model, developed by the National Oceanic and Atmospheric Administration (NOAA), is designed to support simulations related to the transport, dispersion, and deposition of pollutants and other harmful agents in the atmosphere, ultimately determining their deposition at specific receptor points on Earth's surface [15]. In essence, HYSPLIT is a model that examines the influence of meteorological factors (such as temperature, wind speed, wind direction, and rainfall) on the contribution of pollutants transported from various sources to a specific receptor point [16, 17]. Thus, the HYSPLIT model can help identify the trajectory and travel distance of air masses carrying pollutants (often focusing on PM10 and PM2.5) to the study location [11, 12, 13, 15, 17]. The findings from studies in this direction are highly significant for scientists, industrial facilities, regulators, and decision-makers in developing action plans to maintain and improve local, national, and regional air quality. The research results also provide essential information on the issue of air pollution in the study area, encouraging the community to take greater responsibility in preventing disease, improving public health, and reducing air pollution in Bien Hoa City (BHC), Dong Nai Province.
2. METHODS FOR SAMPLE COLLECTION AND ANALYSIS
2.1. Sampling and evaluate dust concentration
The dust sampling point is located at the coordinates 106°49′06.2′′ E; 10°57′22.6′′ N, at the entrance gate number 2 of Bien Hoa Airport, BHC, Dong Nai Province (Figure 1). The TSP (Total Suspended Particles) samples were collected using a high-volume air sampler (Tisch Environment, Inc.) with an intake flow rate of 200 L/min. The filter paper used for sampling was made of glass fiber, circular in shape, with a diameter of 102 mm. PM10 samples were collected using another high-volume air sampler (Tisch Environment, Inc.) with an intake flow rate of 1200 L/min. The filter paper used was also made of glass fiber, rectangular in shape, measuring 203 mm x 254 mm. PM2.5 samples were collected using a high-volume air sampler (E-1000DBLX, Tisch Environment, Inc.) with an intake flow rate of 200 L/min. The filter paper used was made of quartz, circular in shape, with a diameter of 102 mm. All PM sampling devices operated simultaneously at the same location, 12 meters above the ground. Sampling was conducted during the dry season (from March 15, 2023, to March 23, 2023) and the rainy season (from December 8, 2023, to December 16, 2023), which represent the distinct seasonal conditions of the area, characterized by a rainy season (from May to November) and a dry season (from December to April of the following year) [18, 19].
Each dust sample was collected over a total period of 24 hours, providing an adequate representation of the daily average sample. After sampling, the samples (including the filter paper and the dust adhered to its surface) were placed in Petri dishes, sealed in zip lock bags, and transported to the laboratory at the Department of Chemistry and Environment (Vietnam - Russia Tropical Center, Hanoi). The samples were subsequently dried at 110°C for a period of 24 hours and then weighed using a Mettler Toledo XS205 analytical balance, with a precision of 10⁻⁶ g.
All field blanks and duplicate samples were processed in the same manner as real samples, with chemicals, analytical equipment, and personnel accredited under ISO/IEC 17025 (VILAS 856) at the Department of Chemistry and Environment, Joint Vietnam - Russia Tropical Science and Technology Research Center, Hanoi [20].
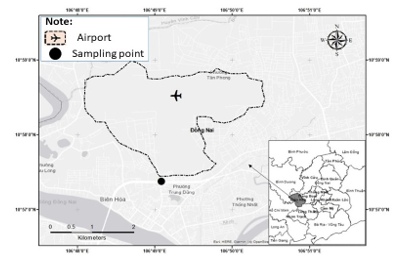
Figure 1. Map of investigation area
2.2. Retrieving dust movement trajectories using the HYSPLIT model.
To identify the main emission sources and the dust movement trajectories, a backward trajectory analysis was conducted at the central location using the HYSPLIT model provided by NOAA. HYSPLIT is an open-source model that operates directly on the OPENair platform. The commands (code) to run the model were executed using the SplitR software in RStudio, which is integrated with the HYSPLIT software. Other necessary meteorological parameters (wind speed, wind direction, pressure) were obtained from NOAA (ftp://arlftp.arlhq.noaa.gov/archives/ reanalysis/RP) to run the HYSPLIT model. The backward trajectories were traced over 96 hours, with calculations performed at 4-hour intervals, at a height of 100 meters above ground level (AGL). A concentration-weighted trajectory (CWT) analysis was employed to understand potential pollution sources. The average concentration of a specific pollutant (or CWT) was calculated using the following formula (1):
![]() (1)
(1)
Where: i and j are the grid cell parameters; k is the trajectory index; n is the total number of trajectories; Ck is the PM2.5 concentration measured at trajectory k; and τijk is the residence time of trajectory k in grid cell (i, j). The higher the value of Cij, the higher the concentration at the receptor location when air masses pass through grid cell (i, j) [21].
3. RESULT
The variations in dust concentrations (TSP, PM10, PM2.5) over the monitoring period in 2023 are summarized and presented in Table 1. A total of 16 samples were collected, with an equal distribution of samples between the rainy and dry seasons. The results show that the dust concentrations for TSP, PM10, and PM2.5 during the dry season (2023) were 97.4 ± 11.4 µg/m3, 64.4 ± 7.9 µg/m3, and 49.9 ± 7.2 µg/m3, respectively. The concentrations of TSP, PM10, and PM2.5 during the rainy season (2023) were 71.5 ± 10.3 µg/m3, 51.4 ± 8.7 µg/m³, and 36.8 ± 7.5 µg/m³, respectively. The concentrations of PM (TSP, PM10, PM2.5) tend to be higher in the dry season and lower in the rainy season. This is also a common pattern observed in studies on air quality in Vietnam. Statistical analysis further confirmed significant seasonal differences, with p-values of 0.0003 for TSP, 0.0073 for PM₁₀, and 0.0032 for PM₂.₅ (Welch’s t-test, α = 0.05). These results indicate that seasonal variation strongly influences ambient particulate matter levels in Bien Hoa City. In comparison with the result of Linh et al. (2023), the PM2.5 dust concentrations during the rainy season monitoring in 2023 were slightly higher than that of the rainy season in 2021 (24.1 ± 12.2 µg/m³), but much lower compared to the dry season in 2022 (63 ± 18.7 µg/m³). The sampling location was similar (near Bien Hoa Airport); however, the dust concentrations may be influenced by various factors such as emissions from local sources and weather conditions, including rainfall, wind direction, and wind speed [13, 17, 16, 22]. Compared to the monitoring results from another study conducted at the same BHC but with a different sampling location (Long Binh Ward), as presented by Le et al. (2024), the PM2.5 dust concentrations during the rainy season monitoring in 2023 were slightly lower than that of the rainy season in 2021 (40.9 ± 23.6 µg/m³) and much lower than the dry season in 2022 (79.9 ± 24.3 µg/m³).
The concentrations of TSP and PM10 during the monitoring period did not exceed the national air quality standards (QCVN 05:2023/BTNMT), where the daily average limit is 200 µg/m³ for TSP and 100 µg/m³ for PM10. The PM2.5 concentrations measured during the rainy season did not exceed the national air quality limit. However, during the dry season, more than 60% of the monitoring days exceeded the limit (QCVN 05:2023/BTNMT; daily average limit of 50 µg/m³). The WHO does not provide a recommended value for TSP in ambient air quality. However, particulate matter with smaller particle sizes (PM10 and PM2.5) exceeded the recommended values multiple times, with limits of 45 µg/m³ for PM10 and 15 µg/m³ for PM2.5.
The monitoring results at BHC indicate that this area experiences a higher level of air pollution from fine particulate matter (PM2.5) compared to the nearby large urban area of Ho Chi Minh City (HCMC). Compared to the results published by Tran et al. (2024), the highest PM2.5 concentration (below 50 µg/m³) is lower than in HCMC (above 70 µg/m³). However, the average PM2.5 concentration in the post-COVID-19 period is significantly higher (around 40 µg/m³ compared to around 15-33 µg/m³). .When compared to the pre-COVID-19 period, PM2.5 concentrations at BHC are much lower than those in HCMC (42 - 344.7 µg/m³) [23].
The statistical distribution chart of PM concentrations presented in Figure 2 indicates that daily fluctuations in total suspended particles (TSP) during both the rainy and dry seasons of 2023 are predominantly governed by variations in PM10 concentrations. In contrast, changes in fine particulate matter (PM2.5) exhibit relatively low variability and contribute minimally to the overall shifts in TSP levels. These findings underscore the dominant role of coarse particles, likely originating from local and neighboring provincial sources such as road dust, construction activities, and resuspension processes in influencing the ambient air quality in the BHC area.
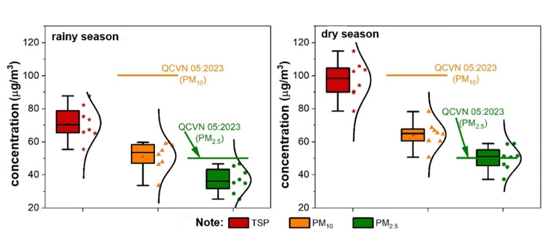
Figure 2. Statistical distribution of dust concentrations in Bien Hoa City, Dong Nai Province
Table 1. Summary of dust concentrations (TSP, PM10, PM2.5) in Bien Hoa City, Dong Nai Province.
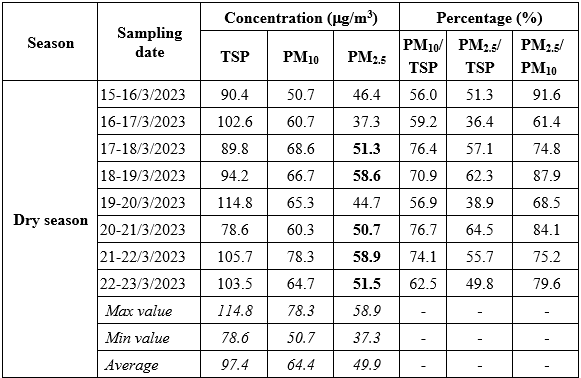
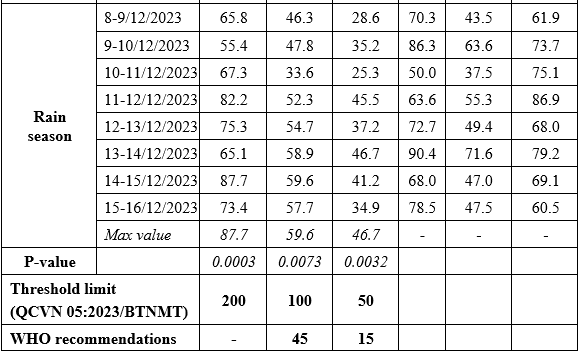
Note: Bold indicate value which is higher than threshold limit according to QCVN 05:2023/BTNMT.
4. DISCUSSION
4.1. Distribution ratio of dust (TSP, PM10, PM2.5) in Bien Hoa City, Dong Nai Province.
Based on the particle size distributions of PM dust (TSP, PM10, PM2.5) during the rainy and dry seasons of 2023 at BHC (Table 1), the distribution ratios of particle pairs are presented using a heat map in Figure 3.
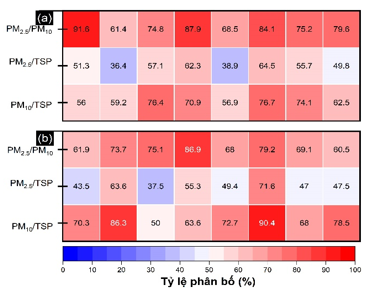
Figure 3. Heat map of the distribution ratio of dust concentrations by different particle sizes of TSP, PM10, and PM2.5 during (a) the rainy season and (b) the dry season of 2023 in Bien Hoa City, Dong Nai Province.
The distribution ratios for the PM pairings PM10/TSP, PM2.5/TSP, and PM2.5/PM10 during the rainy season are 0.73, 0.52, and 0.72, respectively. Meanwhile, the distribution ratios for the same pairs during the dry season are 0.67, 0.52, and 0.78. The results indicate that PM2.5 is the dominant component within PM10 and is also the primary contributor to PM10 dominance within both PM and TSP. These findings align with the study by Linh et al. (2023) from previous years, 2021 and 2022.
The PM2.5/PM10 ratio is notably higher during the dry season compared to the rainy season, while the PM10/TSP ratio exhibits an opposite trend, being lower in the dry season. These patterns indicate that fine particulate matter (PM2.5) in BHC is heavily influenced by transboundary sources, including emissions from neighboring regions or even other countries. This observation aligns with findings from Linh et al. (2023), who highlighted similar contributions of cross-border pollution to PM2.5 levels in their study. Due to its small size, PM2.5 can be transported over long distances, affecting air quality in BHC during the dry season. However, during the rainy season, fine PM2.5 is less mobile and contributes less to the overall pollution. In this case, the higher PM10/TSP ratio in the rainy season suggests that PM10 is more likely to originate from local sources, with a small contribution from nearby areas.
4.2. Simulation of dust movement trajectories using the HYSPLIT model.
The air quality of a given area is often influenced by both local sources (localized emissions) and emissions from activities in neighboring regions, due to the impact of climatic factors. When air masses move through the area, they carry dust and precursor substances, which significantly contribute to variations in the regional air quality. The HYSPLIT receptor model is widely used to qualitatively assess the impact of these air masses [12, 16, 17].
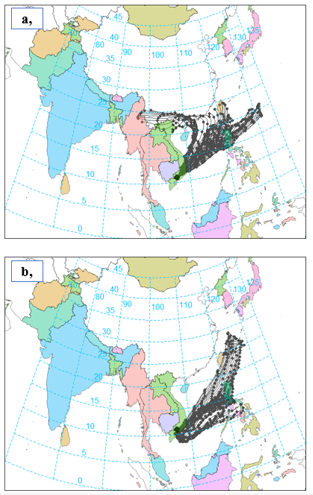
Figure 4. Trajectories of dust movement (PM10, PM2.5) to Bien Hoa City, Dong Nai Province, during (a) the rainy season and (b) the dry season of 2023, extracted using the HYSPLIT model.
Figure 4 illustrates the 96-hour trajectory paths of air masses with a destination at the monitoring station during the sampling period. Through the backward trajectory analysis using the HYSPLIT model, it simulates the meteorological air masses that may have transported small particulate matter such as PM10 and PM2.5. The results show that both seasons in the study were influenced by the prevailing northeast wind direction. The air masses originated from mainland China or the Philippines. During their travel, they carried pollutants from maritime traffic activities into the study area. This is consistent with the observation that PM2.5 and PM10 particles likely have a source from nearby regions or neighboring countries, as mentioned earlier, since they can be transported over long distances and impact the air quality in BHC. This pattern also aligns with previous studies conducted in the same BHC area, although at different sampling times [11, 12, 17, 20].
5. CONCLUSION
A total of 16 sets of dust samples with different particle sizes (TSP, PM₁₀, and PM₂.₅) were simultaneously collected during the rainy and dry seasons of 2023 at BHC, Dong Nai Province. The results showed that the concentrations of TSP, PM₁₀, and PM₂.₅ during the dry season (97.4 ± 11.4 µg/m³, 64.4 ± 7.9 µg/m³, and 49.9 ± 7.2 µg/m³, respectively) were notably higher than those in the rainy season (71.5 ± 10.3 µg/m³, 51.4 ± 8.7 µg/m³, and 36.8 ± 7.5 µg/m³, respectively). PM₁₀ and PM₂.₅ concentrations frequently exceeded the WHO guideline values, and PM₂.₅ levels also surpassed the national limit (QCVN 05:2023/BTNMT). Fine particles contributed substantially to the total dust mass, with PM₂.₅/PM₁₀ and PM₂.₅/TSP ratios often exceeding 50%, indicating that small particles are the predominant component and pose significant potential risks to both the environment and human health.
Backward trajectory analysis using the NOAA-HYSPLIT model revealed that long-range transport likely contributed to PM₂.₅ levels during the dry season, while local sources were the primary contributors in the rainy season. These findings highlight the dual importance of controlling both local emissions and regional contributions to effectively improve air quality in the study area. However, this study has some limitations, including the relatively small sample size (n = 8 per season), the absence of chemical speciation data, and potential biases related to filter handling and pre-treatment. Consequently, conclusions regarding transboundary transport should be considered tentative. Future studies with larger datasets and integrated chemical analyses are recommended to strengthen the evidence base and provide more comprehensive insights into the environmental and public health impacts of fine particulate matter.
Acknowledgements: The authors would like to thank the project "Study on the Characteristics of PCDDs/PCDFs, Dl-PCBs Pollution in the Air during the Dioxin Remediation Process at Bien Hoa Airport," funded by the Vietnam - Russia Tropical Center, for providing the information and data necessary to complete this research.
Author contributions: Nguyen Thanh Tuan: Formal analysis, numerical simulations, sensitivity analysis, investigation, visualization, writing - original draft. Hoang Anh Le: Conceptualization, methodology, data curation, visualization, Writing - review & editing, response to editor and reviewers, supervision. Bui Duy Linh: Resources, data curation, writing - review & editing. Nguyen Duc Thang: Resources, data curation,writing - original draft. Nguyen Thị Thu Ly: Formal analysis, numerical simulations, sensitivity analysis. Nguyen Thi Thu: Formal analysis, numerical simulations, sensitivity analysis. Vu Trung Hieu: Methodology, data curation, visualization.
Declaration of competing interest: The authors declare that they have no known competing financial interests or personal relationships that could have appeared to influence the work reported in this paper.
References
2. OECD, Environmental Outlook to 2050: The Consequences of Inaction. Paris, OECD Publishing, 2012.
3. D. W. Graff, W. E. Cascio, A. Rappold, H. Zhou, Y.-C. T. Huang and R. B. Devlin, Exposure to concentrated coarse air pollution particles causes mild cardiopulmonary effects in healthy young adults, Environmental health perspectives, Vol. 117, No. 7, pp. 1089-1094, 2009. DOI:10.1289/ehp0900558
4. D. Tang et al., Health benefits of improving air quality in Taiyuan, China, Environment International, Vol. 73, pp. 235-242, 2014. DOI: 10.1016/ j.envint.2014.07.016
5. G. Cao, R. Orrù, Current environmental issues and challenges. Springer, 2014.
6. D. A. Vallero, Fundamentals of air pollution. Academic press, 2014.
7. N. J. Schleicher, Chemical, physical and mineralogical properties of atmospheric particulate matter in the megacity Beijing. KIT Scientific Publishing, Vol. 38, 2014.
8. B. R. Gurjar, L. T. Molina and C. S. P. Ojha, Air pollution: Health and environmental impacts. CRC press, 2010.
9. F. A. Al-Jallad, C. C. Rodrigues and H. A. Al-Thani, Ambient levels of TSP, PM10, PM2.5 and particle number concentration in al samha, UAE, Journal of Environmental Protection, Vol. 8, No. 09, pp. 1002-1017, 2017. DOI: 10.4236/ jep.2017.89063
10. MONRE, National Environmental Status Report 2016: Urban environment topic. Ministry of Natural Resources and Environment, 2016.
11. H. A. Le, B. D. Linh, N. T. Tuan and P. T. Huyen, Characteristics of PM2.5 in Long Binh Industry Park, Bien Hoa city, Vietnam: Mass concentrations, chemical composition, source apportionment, and health risk assessment VNU, Journal of Science: Earth and Environmental Sciences, Vol. 40, No.1, pp. 30-39, 2024. DOI: 10.25073/2588-1094/vnuees.5028
12. B. D. Linh, H. A. Le, Q. K. Khoi and N. X. Truong, Chemical characterization, source apportionment, and health risk assessment nexus of PM2.5-bound major heavy metals in Bien Hoa city, southern Vietnam, Atmospheric Environment: X, Vol. 17, p. 100209, 2023. DOI: 10.1016/j.aeaoa.2023.100209
13. B. D. Linh, H. A. Le and N. X. Truong, Physico-chemical properties and transboundary transport of PM2.5 in Bien Hoa City, Dong Nai Province, Southeastern Vietnam, Environmental Science and Pollution Research, Vol. 30, No. 13, pp. 36533-36544, 2023. DOI: 10.1007/s11356-022-24801-z
14. D. -G. N. J. Schleicher, Chemical and mineralogical properties of atmospheric particulate matter in the megacity Beijing.
15. R. Draxler, G. Rolph, HYSPLIT (HYbrid Single-Particle Lagrangian Integrated Trajectory) model access via NOAA ARL READY. Silver Spring, MD, NOAA Air Resources Laboratory, Vol. 25, No.1, 2010. [Online]. Availabe: https://www.ready.noaa.gov/hysplit_metadata.html
16. N. A. Dung, D. H. Son, N. D. Dong and N. T. D. Hanh, Application of HYSPLIT model to evaluate the relationship between meteorological parameters and PM10 content in the atmospheric environment in Ha Noi city, Vietnam, Engineering and Technology, Vol. 3, No. 2, pp. 432-442, 2000. DOI: 10.32508/ stdjet.v3i2.71
17. D. H. Huy, N. D. T. C Chi, N. P. S Phu, T. T, Hien, Fine particulate matter (PM2.5) in Ho Chi Minh City: Analysis of the status and the temporal variation based on the continuous data from 2013-2017, Science and Technology Development Journal: Natural Science, Vol. 2, No.5, pp.130-137, 2018.
18. N. T. Hung, I. I. Kosinova, D. T. L. Anh, Modeling air pollution in Dong Nai province, Vietnam, Geography, Environment, Sustainability, Vol. 13, No.2, pp.166-174, 2020. DOI: 10.24057/2071-9388-2019-44
19. B. D. Linh, H. A. Le, N. X. Truong, N. V. Thanh, N. T. Nang and N. N. Hung, Evaluation of mass concentration and size distribution of fine particles (PM2.5) in Bien Hoa City, Dong Nai Province VNU, Journal of Science: Earth and Environmental Sciences, Vol. 38, No. 3, pp. 93-100, 2022. DOI: 10.25073/2588-1094/vnuees.4862
20. BoA, Bureau of Accreditatin: Search Laboratories: Department of Chemistry and Environment. [Online]. Availabe: https://www.boa.gov.vn/vi/tim-kiem-thi-nghiem?field_ dichvu_vilas_value=&title=&field_dichvu_chuquan_value=&&&combine=&page=10. Accessed: June 5, 2024.
21. D. Carslaw, The openair manual-open-source tools for analysing air pollution data, Manual for version, Vol. 1, No. 4, pp. 1-4, 2015.
22. E. Gramsch et al., Influence of surface and subsidence thermal inversion on PM2.5 and black carbon concentration, Atmospheric Environment, Vol. 98, pp. 290-298, 2014. DOI: 10.1016/j.atmosenv.2014.08.066
23. L. T. Bui, P. H. Nguyen, D. C. M. Nguyen, Spatio-temporal modelling and related factors analysis of PM2.5 pollution: A case study of Ho Chi Minh city, Vietnam, Physics and Chemistry of the Earth, Parts A/B/C, Vol. 131, p. 103417, 2023. DOI: 10.1016/j.pce.2023.103417