MORPHOMETRIC RELATIONSHIPS BETWEEN SAGITTAL OTOLITH SHAPE AND BODY SIZE IN FIVE MARINE FISH SPECIES FROM LANG CO - HAI VAN, VIETNAM
Institute of Tropical Ecology, Joint Vietnam-Russia Tropical Science and Technology Research Center
63 Nguyen Van Huyen Street, Nghia Do Ward, Hanoi, Vietnam
Phone: +84 969452414; Email: phamtandung24@gmail.com
Main Article Content
Abstract
This study examines the relationship between sagittal otolith morphology and body size in five common marine fish species-Selaroides leptolepis, Sardinella gibbosa, Gerres filamentosus, Lutjanus russellii, and Selar crumenophthalmus-from the Lang Co - Hai Van coastal area of Vietnam. A total of 210 specimens were analyzed using Basic Dimension Parameters (BDPs: otolith length, width, area, and perimeter), Shape Indices (ShIs), and somatic traits (total length and body weight). MANOVA and Linear Discriminant Analysis (LDA) results revealed significant interspecific differences in otolith shape, with high classification accuracy (84.78-100%) and perfect discrimination for Lutjanus russellii. Regression analyses demonstrated strong linear correlations between otolith dimensions and body size, especially with otolith height and area (R² up to 0.962). Additionally, length-weight relationships (LWRs) showed species-specific allometric growth patterns: positive allometry in Gerres filamentosus and Selaroides leptolepis, and negative allometry in Lutjanus russellii, Sardinella gibbosa, and Selar crumenophthalmus, suggesting ecological and physiological variability across taxa. These findings support the use of otolith morphometrics for species identification and fish size estimation, with practical applications in fisheries biology, dietary analysis, and historical ecology.
Keywords
fish, predict, LWRs, ecology, BDP
Article Details
- Highlights
Otolith shape descriptors combined with Linear Discriminant Analysis (LDA) effectively distinguished five marine fish species in the Lang Co – Hai Van area, with classification accuracy ranging from 84.78% to 100%.
MANOVA analysis revealed clear morphological differences among species, especially Lutjanus russellii, although partial overlaps were observed between Gerres filamentosus and Selar crumenophthalmus.
Linear regression models showed strong correlations between otolith size and body size, with most coefficients of determination (R²) exceeding 0.90.
Length-weight relationship (LWR) analysis indicated positive allometric growth in Gerres filamentosus and Selaroides leptolepis, while other species-particularly Lutjanus russellii-exhibited negative allometry (b < 3).
1. INTRODUCTION
The sagittal otolith of teleost fish is composed of calcium carbonate crystals embedded in a protein matrix [1, 2]. These otoliths are located bilaterally within the cranial cavity, posterior to the eyes, but not directly attached to bone structures. They appear as opaque white calcareous bodies [3]. The sagitta exhibits species-specific morphological features and tends to show limited shape variation during ontogenetic development in certain species [4]. The size and shape of otoliths vary according to the body size and species of the fish. Teleosts possess three pairs of otoliths: sagittae, asterisci, and lapilli. Due to their dense composition, otoliths are resistant to degradation and dissolution, making the sagitta particularly useful for species identification based on its distinct morphology [5, 6].
Numerous studies have focused on the sagitta, as it is generally the largest otolith among the three types in most teleost species [7, 8]. Recently, otolith shape analysis has been employed to distinguish between species and populations. Among various approaches for stock identification, otolith microchemistry has been recognized as particularly valuable for marine species with high gene flow and is often used in conjunction with genetic and tagging methods [9]. Building on this foundation, recent studies have demonstrated that otolith morphology-through the use of shape indices and Fourier analysis-not only enables clear discrimination among closely related species such as Scomber [10] and Hypomesus [11], but also reveals subtle intraspecific shape variations that reflect geographic population structure. In addition to conventional methods of species identification, such as morphological analysis and DNA sequencing, otolith morphology is particularly valuable in archaeological reconstructions of historical fish assemblages [12] and in identifying prey species in dietary studies, as otoliths resist digestion.
Analysis of sagitta size and shape is an effective tool for species discrimination and population identification [13, 14]. Commonly used shape descriptors include Basic Dimension Parameters (BDP: otolith length - OL, otolith width - OW, perimeter - OP, and area - OA) and Shape Indices (ShI: form factor, roundness, aspect ratio, circularity, rectangularity, and ellipticity) [10, 11, 15]. Using various statistical analyses, previous studies have evaluated differences in otolith morphology among fish species. Lin & Al-Abdulkader recently applied otolith shape analysis to identify species from several families in the western Arabian Gulf and demonstrated increased classification accuracy when combining shape indices with linear discriminant analysis (LDA) [16].
Otoliths record objective biological information throughout a fish's life, including age, size, growth patterns, and ontogenetic development. They are used to estimate fish age [17, 18], differentiate species and populations [10, 11], manage fishery resources [19], and identify prey items [20]. These data are essential for fisheries management, predator-prey studies, and archaeological research [21]. The metabolic processes that influence fish growth also affect otolith development, resulting in observable correlations between otolith and body size.
The Lang Co - Hai Van coastal region represents a climatic transition zone between the subequatorial monsoon of the southern East Sea and the tropical monsoon of the northern East Sea. This creates a distinctive hydro-climatic and geoecological interface between land and sea. Five ecologically and economically significant fish species-Selaroides leptolepis, Sardinella gibbosa, Gerres filamentosus, Lutjanus russellii, and Selar crumenophthalmus-are key targets of local fisheries. These species exhibit diverse ecological characteristics, including variations in habitat and distribution. For example, Selaroides leptolepis (Carangidae) inhabits mid to surface waters nearshore, displaying rapid growth and schooling behavior; Sardinella gibbosa (Clupeidae) is a small pelagic planktivore found in productive coastal areas; Gerres filamentosus (Gerreidae) is a benthic species adaptable to both marine and brackish environments; Lutjanus russellii (Lutjanidae) occupies reef-associated habitats and demonstrates habitat shifts during its life cycle; and Selar crumenophthalmus (Carangidae) is a schooling pelagic species preying primarily on small crustaceans.
The ecological diversity, morphological traits, and habitat preferences of these five species provide a representative model to analyze the relationship between body size and otolith morphology, supporting research on growth, population structure, and fisheries management in the study area.
The objective of this study is to apply BDP and ShI metrics to assess interspecific morphological differences in otoliths of five representative fish species from the Lang Co – Hai Van region. Furthermore, the study aims to examine the relationship between otolith morphology and selected body traits. The resulting regression models may be applied to infer species composition and fish size in predator diet studies or to reconstruct past fish community structures using otolith samples. Additionally, the study evaluates the length-weight relationship to assess the population condition of the examined species.
2. MATERIALS AND METHODS
2.1. Study Area, Sampling Period, and Study Subjects
Fish samples were collected from the coastal waters of Lang Co - Hai Van, Thua Thien Hue Province, Vietnam (Fig. 1) in June 2024 and February 2025. Sampling was conducted using handlines, trap nets, and trawl nets. The study focused on five fish species, with a total of 210 individuals collected and analyzed for subsequent morphological and otolith-based assessments (Table 1).
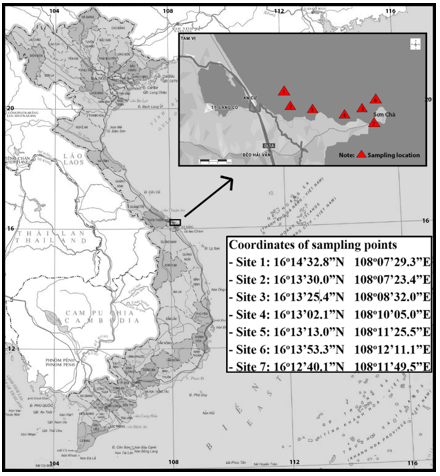
Figure 1. Sampling locations for five fish species in the Lang Co - Hai Van coastal region.
2.2. Sample Collection and Analysis Procedures
After capture, fish specimens were immobilized by pinning the fins, sprayed with a thin layer of formalin, and labeled with specimen codes. Total length (TL) was measured to the nearest millimeter, and body weight (W) was recorded to the nearest 0.1 g using a 600 g × 0.01 g precision pocket electronic balance. Photographs of the specimens were taken prior to otolith extraction. The number of otoliths and corresponding fish samples is presented in Table 1.
2.2.1. Otolith Extraction
A Kiprun 3.6V mini cutter was used to decapitate the fish and extract the sagittal otoliths. The otoliths were cleaned and dry-preserved in individually labeled vials. Images of the left otoliths were captured using an Olympus SZ61 stereomicroscope equipped with an SC180 digital camera.
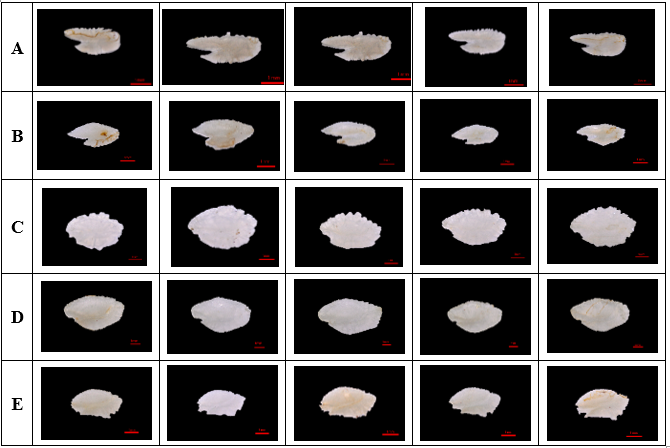
Figure 2. Representative otolith samples of the five species: (A) Selaroides leptolepis; (B) Sardinella gibbosa; (C) Gerres filamentosus; (D) Lutjanus russellii; (E) Selar crumenophthalmus.
Species identification was based on morphological characteristics following the references of Froese & Pauly; Kimura et al.; Lieske & Meyers and Nakabo [22-25], which enabled identification of adult specimens.
2.2.2. Measurement of Basic Dimension Parameters and Calculation of Shape Indices
Only left sagittal otoliths were used for analysis. A total of 150 left sagittal otoliths were measured and analyzed for shape descriptors using Olympus CellSens v2.2 and ShapR software [26]. The measured BDPs included otolith length (OL), otolith height (OH), otolith perimeter (OP), and otolith area (OA). Six common shape indices (ShIs) were calculated based on the ratios of OL, OW, OA, and OP, following Agüera & Brophy [27]: aspect ratio = OL/OW; ellipticity = (OL - OW) / (OL + OW); circularity = OP/A2; rectangularity = OA/(OL × OW); roundness = 4OA/πOL2; and form factor = 4πOA/OP2 [10, 27].
2.2.3. Statistical Data Processing
Total length (TL) and body weight (W) were measured with high precision (TL to the nearest mm and W to 0.1 g). The relationship between body length and weight was analyzed using the regression model proposed by R.J.H. Beverton and S.J. Holt [28]:
W = a×TLb (1)
where: W - is the body weight (g),
TL - is the total body length (mm),
and a and b are regression coefficients.
The values of a and b were estimated using linear regression analysis in SPSS.
The following morphometric relationships were analyzed: OL - TL; OH - TL; OL - W and OH - W; OP - TL; OA - TL; OP - W and OA - W. All morphometric relationships were modeled using simple linear regression, selected based on the best fit to the data distribution. The general form of the linear regression model used is: y = a + bx, where x is the independent variable and y is the dependent variable derived from empirical data. Coefficients a and b were determined from actual measurements and used to estimate theoretical values of y for given values of x. The significance of the regression was tested using analysis of variance (ANOVA).
The analyses of LDA scatter plots, MANOVA, and confusion matrices were conducted using Python and relevant scientific libraries to visualize group separation and assess the degree of difference between otolith groups using LDA, and to determine whether statistically significant differences exist among groups using MANOVA. Specifically, Linear Discriminant Analysis (LDA) was implemented using the LinearDiscriminantAnalysis module from sklearn.discriminant_analysis, along with LabelEncoder from sklearn.preprocessing for class encoding. Model performance was evaluated using the confusion_matrix function from sklearn.metrics [29]. Multivariate Analysis of Variance (MANOVA) was performed using the MANOVA module from the statsmodels.multivariate.manova package [30].
3. RESULTS
3.1. Interspecific Differences Based on Otolith ShI-BDP Indices
MANOVA Results
Table 1. The MANOVA results based on BDP-ShI indices indicated a significant multivariate effect of species on otolith morphology
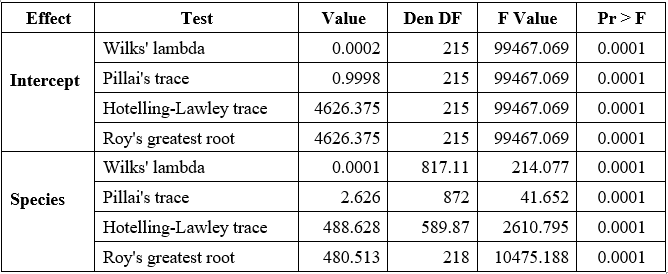
Note: Den DF: Degrees of freedom for the error term; F Value: Test statistic for group differences; Pr > F: p-value; significance level (p < 0.05 indicates a significant difference).
The MANOVA results based on BDP-ShI indices indicated a significant multivariate effect of species on otolith morphology. Wilks’ lambda was 0.0001 with F(40, 817.11) = 214.077, p < 0.0001. The low lambda value suggests that a large portion of the variance in the dependent variables is explained by species, while the relatively large numerator (40) and denominator (817.11) degrees of freedom reflect the multivariate nature of the model, which includes multiple shape variables and five species. The corresponding F value, over 200, indicates that the group differences are not only statistically significant but also substantial in magnitude. Pillai’s trace, which was 2.626 with F(40, 872) = 41.652, p < 0.0001, also points to consistent differences across species. Although this F value is lower than that of Wilks’ test, it still reflects a strong group effect, and the Pillai trace value itself suggests that a considerable proportion of the total multivariate variance is attributed to species. The Hotelling–Lawley trace was 488.628 with F(40, 589.87) = 2610.795, p < 0.0001, the highest F-value among the four tests. This statistic is sensitive to large differences and further highlights the pronounced separation in otolith shape among species. Notably, the relatively smaller denominator degrees of freedom in this test (589.87) might contribute to a more inflated F-value, but the result remains highly significant. Roy’s greatest root was 480.513 with F (10, 218) = 10475.188, p < 0.0001. This test is based on the largest eigenvalue and assesses the maximum separation among group centroids along a single dimension. The large value of Roy’s root and the very high F statistic indicate that at least one discriminant function clearly separates the species. Together, the combination of small Wilks' lambda, large Pillai trace and Hotelling–Lawley values, and the dominance of the first eigenvalue from Roy's root, all with highly significant p-values, consistently confirm that the otolith shSape descriptors derived from BDP–ShI indices are able to differentiate among Selaroides leptolepis, Sardinella gibbosa, Gerres filamentosus, Lutjanus russellii, and Selar crumenophthalmus with strong statistical support.
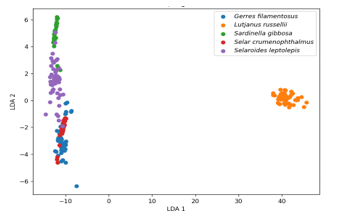
Figure 3. Linear Discriminant Analysis (LDA) scatter plot showing separation among five fish species based on BDP–ShI otolith shape indices: Selaroides leptolepis, Sardinella gibbosa, Gerres filamentosus, Lutjanus russellii, and Selar crumenophthalmus.
The LDA scatter plot illustrates clear interspecific separation in otolith morphology as captured by the BDP–ShI descriptors (Fig. 3). The first linear discriminant function (LDA 1), which accounts for the greatest variance between groups, effectively separates Lutjanus russellii from the other species, forming a distinct and compact cluster on the far right of the plot. This indicates a strong morphological divergence of this species’ otoliths relative to the others. Along the vertical axis (LDA 2), partial separation is observed among Selaroides leptolepis, Sardinella gibbosa, Gerres filamentosus, and Selar crumenophthalmus. While some overlap is present among these four species, particularly in the central region, species such as Selaroides leptolepis and Sardinella gibbosa tend to form loosely grouped clusters with distinguishable centroids. In contrast, Gerres filamentosus and Selar crumenophthalmus exhibit closer proximity and partial overlap, suggesting more similar otolith shape patterns based on the descriptors used. Overall, the distribution along LDA axes confirms that the BDP–ShI indices contain sufficient information to distinguish among species, with varying degrees of morphological separation.
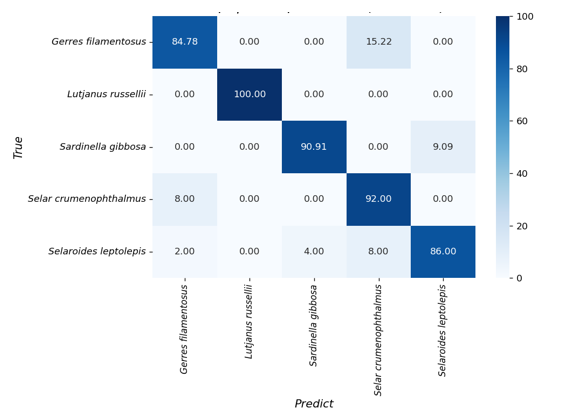
Figure 4. Confusion matrix heatmap showing classification accuracy (%) of five fish species based on BDP–ShI otolith shape descriptors using Linear Discriminant Analysis (LDA).
The confusion matrix illustrates the classification performance of the LDA model in distinguishing five fish species based on BDP–ShI otolith descriptors (Fig. 4). The overall classification accuracy is high, with Lutjanus russellii achieving perfect discrimination (100%), indicating its otolith shape is well separated from all other species in the dataset. Selar crumenophthalmus and Sardinella gibbosa were also classified with high accuracy, reaching 92.00% and 90.91%, respectively. Gerres filamentosus was identified with 84.78% accuracy, with most misclassifications attributed to Selar crumenophthalmus (15.22%). Selaroides leptolepis showed the lowest classification accuracy among the five species (86.00%), with misclassification distributed across Sardinella gibbosa (4%) and Selar crumenophthalmus (8%). These results suggest that while the BDP–ShI descriptors provide reliable species-level discrimination, there remains some overlap in otolith morphology among closely related or morphologically similar species.
3.2. Relationship Between Body Length and Weight in Five Fish Species
3.2.1. Sample Size and Morphometric Range
Table 2. Sample size and morphometric data for five fish species from the Lang Co - Hai Van coastal area
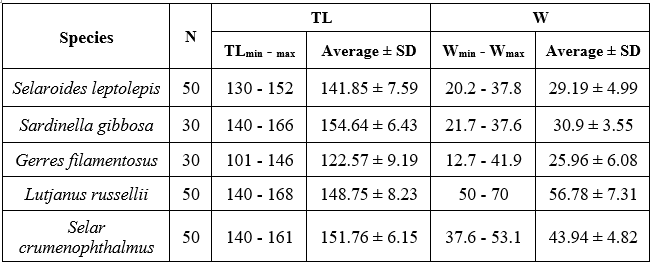
Note: TL (mm) = total length of the fish; W (g) = body weight of the fish.
A total of 210 specimens from five different species were used in this study, with no distinction made between males and females. All 210 left sagittal otoliths were successfully extracted and analyzed. Gerres filamentosus exhibited the smallest body size, with total lengths ranging from 101 to 146 mm (mean ± SD: 122.57 ± 9.19 mm) and weights ranging from 12.7 to 41.9 g (mean ± SD: 25.96 ± 6.08 g). Conversely, Lutjanus russellii had the largest body size, with total lengths ranging from 140 to 168 mm (mean ± SD: 148.75 ± 8.23 mm) and weights between 50 and 70 g (mean ± SD: 56.78 ± 7.31 g).
3.2.2. Length-Weight Relationships (LWRs)
Table 3. Length-weight relationships (LWRs) for five marine fish species based on total length
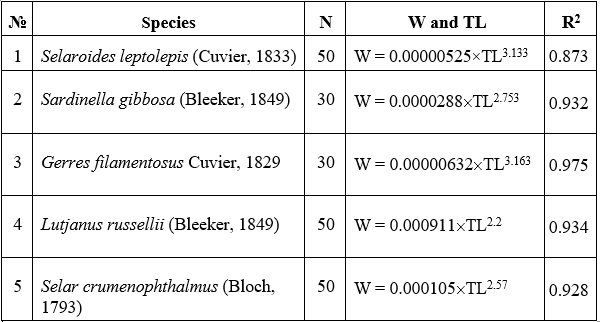
Note: Total length (TL, in cm) and body weight (W, in g) are presented for each species, along with the corresponding sample size (N) and coefficient of determination (R²) for the length-weight regression model.
The regression equations describing the length-weight relationships (LWRs) for the five fish species collected from the coastal area of Lang Co – Hai Van are summarized in Table 3. The results indicate a strong positive correlation between total length (TL) and body weight (W) across all species, with coefficients of determination (R²) ranging from 0.873 to 0.975 (p < 0.05). These values confirm the statistical significance and goodness-of-fit of the models. As presented in Table 2, the estimated allometric coefficients (b) varied among species. The lowest b value was observed in Lutjanus russellii (b = 2.2), while the highest belonged to Gerres filamentosus (b = 3.163). Two species, Gerres filamentosus (b = 3.163) and Selaroides leptolepis (b = 3.133), exhibited positive allometric growth (b > 3), suggesting faster weight gain relative to length. In contrast, Selar crumenophthalmus and Sardinella gibbosa had b values of 2.57 and 2.753, respectively, indicating slight negative allometric patterns.
3.3. Relationship Between Basic Otolith Dimensions (BDP) and Fish Body Size
The relationship between otolith morphometric parameters and body size in the five studied species was evaluated using simple linear regression models that best matched the data distributions (Fig. 5-9). The current study showed that otolith dimensions are linearly related to fish body size, with generally strong to very strong correlations, suggesting a proportional relationship between otolith and somatic development. When analyzing the relationship between otolith morphology and total length (TL), the models explained over 90% of the variance for most species, except for the OL–TL relationship in Selar crumenophthalmus. In Selaroides leptolepis, the relationship between otolith dimensions and body weight (W) showed a coefficient of determination below 90%. Similarly, in Gerres filamentosus, the regression models for OL–TL and OL–W explained less than 90% of the variance.
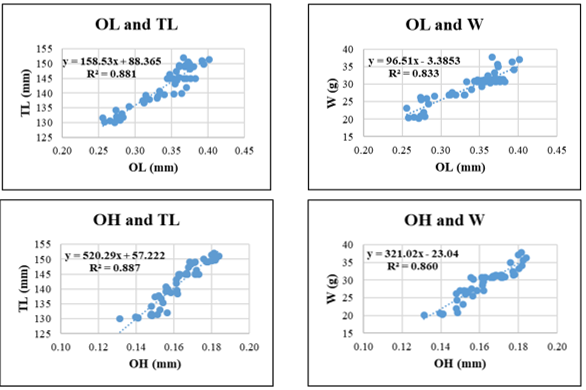
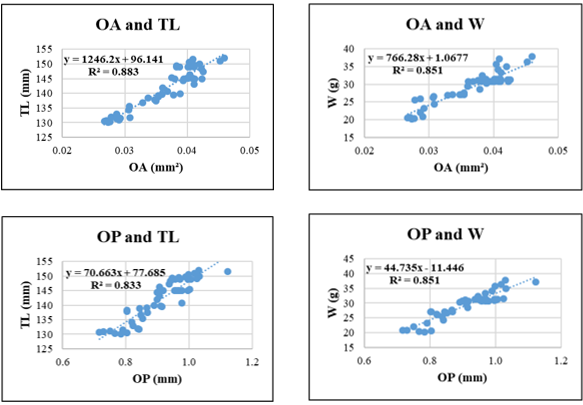
Figure 5. Relationships between sagittal otolith morphometric parameters and total length (TL) and body weight (W) in Selaroides leptolepis. Coefficient of determination (R²) is indicated for each regression. OL: otolith length; OH: otolith height; OA: otolith surface area; OP: otolith perimeter. All regression models are statistically significant at p < 0.05.
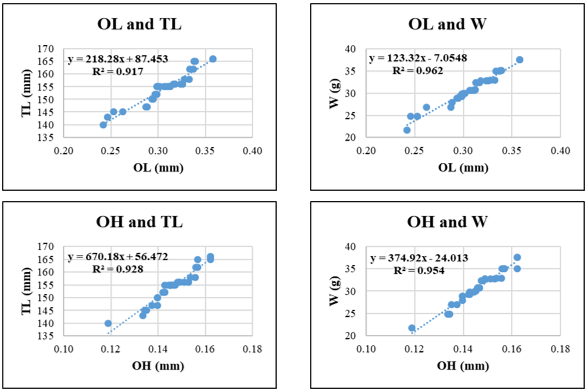
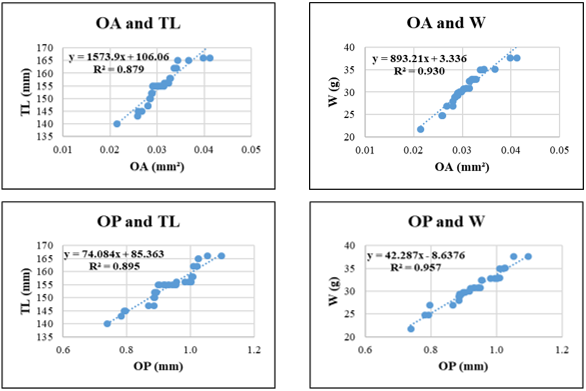
Figure 6. Relationships between sagittal otolith morphometric parameters and total length (TL) and body weight (W) in Sardinella gibbosa. Coefficient of determination (R²) is indicated for each regression. OL: otolith length; OH: otolith height; OA: otolith surface area; OP: otolith perimeter. All regression models are statistically significant at p < 0.05.
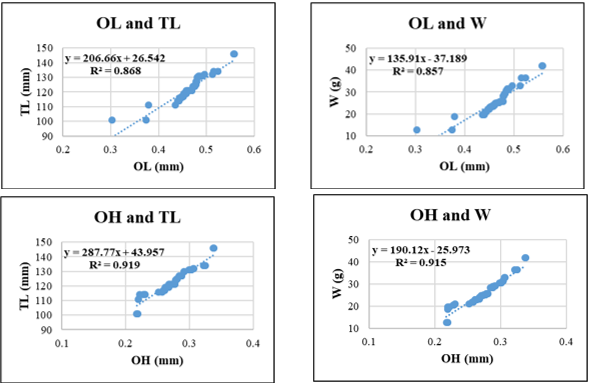
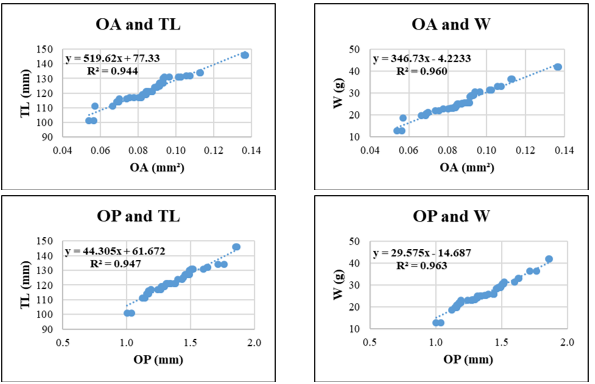
Figure 7. Relationships between sagittal otolith morphometric parameters and total length (TL) and body weight (W) in Gerres filamentosus. Coefficient of determination (R²) is indicated for each regression. OL: otolith length; OH: otolith height; OA: otolith surface area; OP: otolith perimeter. All regression models are statistically significant at p < 0.05.
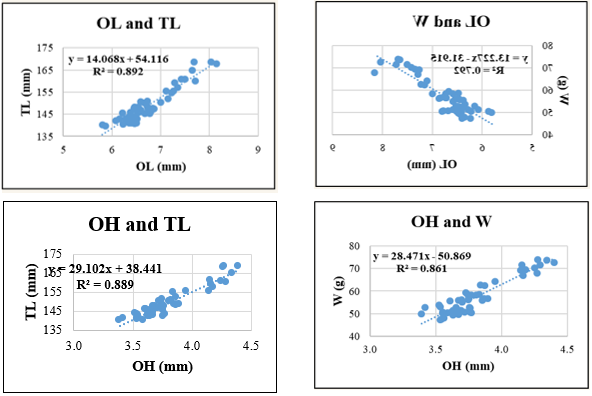
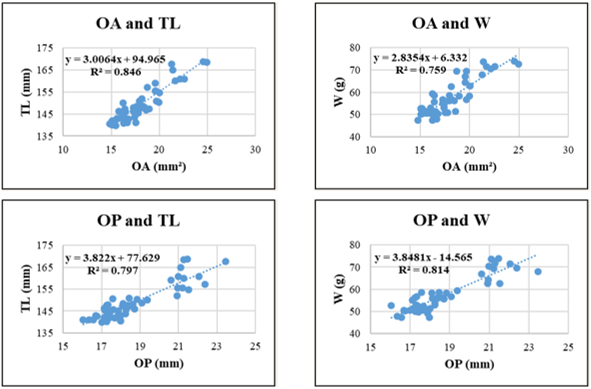
Figure 8. Relationships between sagittal otolith morphometric parameters and total length (TL) and body weight (W) in Lutjanus russellii. Coefficient of determination (R²) is indicated for each regression. OL: otolith length; OH: otolith height; OA: otolith surface area; OP: otolith perimeter. All regression models are statistically significant at p < 0.05.
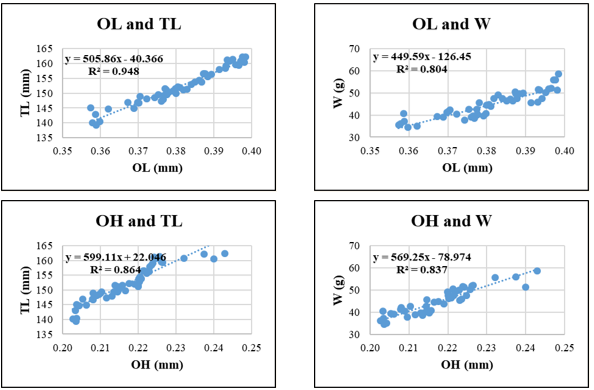
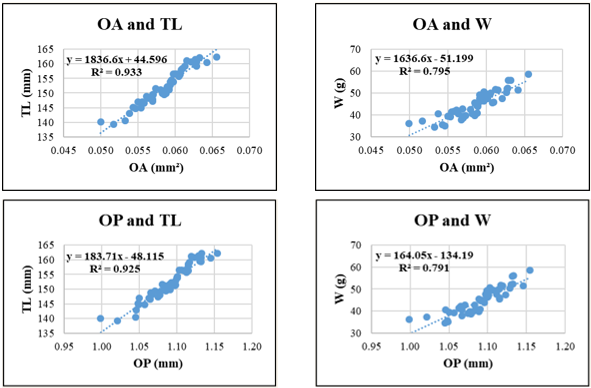
Figure 9. Relationships between sagittal otolith morphometric parameters and total length (TL) and body weight (W) in Selar crumenophthalmus. Coefficient of determination (R²) is indicated for each regression. OL: otolith length; OH: otolith height; OA: otolith surface area; OP: otolith perimeter. All regression models are statistically significant at p < 0.05.
Coefficient of determination (R²) is indicated for each regression. OL: otolith length; OH: otolith height; OA: otolith surface area; OP: otolith perimeter. All regression models are statistically significant at p < 0.05. Linear regression analyses between otolith morphometric parameters (OL: otolith length, OH: otolith height, OA: otolith area, OP: otolith perimeter) and fish body metrics (total length - TL and weight - W) were performed for five marine fish species (Fig. 5-9). All relationships were statistically significant (p < 0.05), with coefficients of determination (R²) ranging from 0.759 to 0.963, reflecting moderate to strong linear associations across species.
For Selaroides leptolepis, all otolith parameters exhibited consistent positive relationships with both TL and W. The highest R² was observed in the OH-TL regression (R² = 0.887), followed closely by OA-TL (R² = 0.883) and OL-TL (R² = 0.881). The lowest R² appeared in OL-W (R² = 0.833) and OP-TL (R² = 0.833), suggesting that otolith length and perimeter, though still informative, may be more variable when predicting body weight or total length in this species.
In Sardinella gibbosa, the strongest relationship was found between OL–W (R² = 0.962), followed by OP and W (R² = 0.957) and OH-W (R² = 0.954), highlighting the potential of vertical otolith development and edge morphology as indicators of somatic growth. The relationships involving OH and TL or OA and W showed slightly lower, yet still robust R² values (0.928 and 0.930, respectively).
Gerres filamentosus exhibited the strongest overall correlations among the five species. The regression between OP and W yielded the highest R² (0.963), followed closely by OA-W (R² = 0.960), OA–TL (R² = 0.944), and OP–TL (R² = 0.947). Even the lowest R² in this species (OL–W = 0.857) remained within an acceptable predictive range, indicating tight coupling between otolith shape and body development in this species.
For Lutjanus russellii, regression models showed greater variability in explanatory power. The highest R² was observed in OL-TL (0.892), suggesting that otolith height scales well with body length. However, relationships involving OA and W (R² = 0.759) or OP and TL (R² = 0.797) showed relatively lower correlations, possibly indicating more variable otolith surface and edge development in this species due to ecological or physiological factors.
Selar crumenophthalmus displayed high R² values for relationships involving OA–TL (0.933) and OP–TL (0.925), indicating strong predictive potential of otolith surface and perimeter features for body length. Conversely, W-related regressions such as OA-W (R² = 0.795) and OP-W (R² = 0.791) were less predictive, possibly due to individual variation in weight relative to otolith structure.
Across species, OH and OA generally showed stronger correlations with TL and W than OL and OP. OH-W regressions exceeded R² = 0.85 in all species and surpassed 0.95 in Gerres filamentosus and Sardinella gibbosa, underscoring the stability of vertical otolith development relative to fish growth. OP, in contrast, showed more variability and generally yielded lower R² values when predicting W, which may reflect species-specific differences in otolith edge complexity (Fig. 5-9).
4. DISCUSSION
The results of the multivariate statistical analysis (MANOVA), using Wilks’ lambda, Pillai’s trace, Hotelling-Lawley trace, and Roy’s greatest root, demonstrate significant differences in otolith morphology among the five studied fish species (Table 2). These findings are consistent with Teimori et al. [31], who showed that otolith shape indices and morphometric variables provide high classification accuracy for marine fishes, confirming species-level morphological differentiation (Table 2). The high F-values and significant p-values across all four tests indicate strong group separation, a result also observed in other studies using similar morphometric descriptors [32,33]. In particular, Lutjanus russellii displayed distinct otolith morphology, supporting the notion that species inhabiting structurally complex habitats, such as reefs, may exhibit unique sagittal otolith shapes. The classification accuracy illustrated in the confusion matrix (84.78% to 100%) highlights the robustness of BDP–ShI indices in practical identification tasks (Fig. 3). This aligns with Salimi et al., who demonstrated over 90% accuracy in species classification using otolith contour features and discriminant analysis [34]. The perfect classification of Lutjanus russellii supports its morphological distinctiveness, while partial overlaps among other species may reflect phylogenetic or ecological similarities, as discussed in Teimori et al. and Agüera & Brophy [27, 31].
These results underscore the utility of otolith-based morphometric analyses in fisheries science, paleobiology, and predator-prey ecology. As shown in Lin et al., otoliths persist in fossil records and digestive residues, allowing retrospective identification of species composition in both archaeological and ecological contexts [12].
In marine environments, fish growth rates are influenced by various external factors such as water quality, food quantity and quality, and temperature. A decoupling between somatic and otolith growth has been observed under elevated temperature conditions, wherein body growth halts while otolith growth may continue [35]. Many linear relationships between otolith and body size may originate from different growth phases [36]. In this study, fish and otolith size parameters were estimated based on a large and consistent sample size, and all indices were properly measured using appropriate statistical models. Overall, fish total length exhibited a linear relationship with otolith length. Thus, fish size (length and weight) can be predicted with reasonably high confidence based on otolith length. However, this relationship is not always reliable.
The association between otolith size and fish length may depend on the rate of growth and development of the fish [37]. Otolith length generally shows a linear relationship with fish length until the fish reaches its maximum size; beyond that point, the otolith primarily increases in thickness [38, 39].
The identification of fish species in the diets of apex predators (such as piscivorous fish and seabirds) requires specific and accurate indicators, and otoliths fulfill this role effectively. Otoliths recovered from the gastrointestinal tract, feces, or regurgitated material of fish-eating animals have been widely used for prey identification [20, 40, 41]. In trophic studies, accurate identification of fish prey via otoliths is essential. Regression-based relationships between otolith length and fish length or weight can also be used to estimate the size and/or biomass of consumed prey [21, 40, 42]. This information can then be used as an indirect indicator of fish distribution and to quantify the potential impacts of natural predation [43].
The significant linear relationships observed between otolith morphometric descriptors (OL, OH, OA, OP) and fish body size parameters (total length - TL and body weight - W) across all five species confirm the functional and developmental integration of otolith growth with somatic development. These findings align with previous studies [4, 44], reinforcing the relevance of otolith morphometrics in back-calculating fish size, evaluating condition, and supporting ecological inference.
Among the otolith variables, OH and OA consistently demonstrated the highest predictive power across species. For instance, in Gerres filamentosus, OP-W and OH-W regressions yielded the highest R² values (0.963 and 0.960, respectively), indicating that otolith edge length and vertical height scale closely with somatic mass. Similarly, in Sardinella gibbosa and Selar crumenophthalmus, OH-TL and OA-TL relationships also produced high coefficients of determination (>0.92), suggesting that surface and height-related otolith metrics may offer particularly robust indicators of fish size. In contrast, OL and OP yielded slightly lower R² values in some species, especially in weight-based models (e.g., OL-W in Selaroides leptolepis, R² = 0.833; OP-W in Lutjanus russellii, R² = 0.814), likely due to morphological plasticity or species-specific variation in edge development.
In addition to regression coefficients, the scatter plots revealed distinct distributional patterns. For most species, data points were tightly clustered around the regression lines, reflecting low residual variance and a strong linear fit. This was especially true in Gerres filamentosus and Selaroides leptolepis, where the compact distribution of points suggested homogeneity in growth rates, possibly driven by stable feeding conditions or synchronized age structures. Lutjanus russellii exhibited the widest scatter, particularly in regressions involving OA-W and OP-TL, which may reflect ecological heterogeneity, variable life-history strategies, seasonal reproductive investment, or reduced condition, consistent with its notably low allometric coefficient (b = 2.2, Table 3), implying that individuals in this population grow in length disproportionately to weight gain, possibly due to food limitation. While the present study focused on adult individuals to ensure morphological stability and comparability, future investigations incorporating broader size ranges-including juveniles and older specimens-may reveal stage-specific growth patterns and disproportional otolith development. Such studies, particularly across different geographic regions, would be valuable in clarifying species-specific responses to environmental and ecological variability. However, current research on otolith morphology of these species in Vietnam remains limited, highlighting the need for further foundational work.
Interestingly, in Selar crumenophthalmus, the TL-based regressions involving OA and OP showed well-aligned, concentrated distributions, while W-based models such as OP–W exhibited slightly more scatter, suggesting that while otolith growth remains proportional to length, weight may fluctuate more due to physiological factors or reproductive stage. These patterns underscore the value of combining statistical strength (R²) with visual assessment of data distribution to evaluate the reliability and biological consistency of morphometric models.
From an applied standpoint, these species-specific regressions provide a practical basis for estimating fish size using otolith dimensions, especially in cases where body measurements are unavailable. This approach is particularly useful in dietary studies of predators, historical samples, or fisheries bycatch where only otoliths are preserved. Furthermore, the observed variability in model strength among species and parameters suggests that localized or population-specific equations may be necessary for accurate reconstructions.
The findings from Table 3 confirm the existence of species-specific variations in growth patterns. The observed range of R² values (0.873–0.975) indicates that TL and W are highly correlated in all species studied, reinforcing the reliability of LWR models in describing somatic development. The allometric coefficient b provides insights into the nature of growth. Values greater than 3, as found in Gerres filamentosus and Selaroides leptolepis, reflect positive allometric growth-where weight increases more rapidly than length-typically associated with favorable environmental and nutritional conditions. Notably, the b values for these two species fall within the expected ranges reported in FishBase (Gerres filamentosus: 2.81-3.25; Selaroides leptolepis: 2.84-3.30), suggesting that the sampled populations are likely in stable ecological conditions. In contrast, the b value for Lutjanus russellii (2.200) is substantially lower than most FishBase records (2.55-3.20), implying that individuals in this population may grow in length without corresponding weight gain. This could reflect potential factors such as food limitation, environmental stress, or reproductive investment. Similarly, Selar crumenophthalmus (b = 2.570) and Sardinella gibbosa (b = 2.753) exhibited negative allometric growth, with b values slightly below the standard reference ranges. These deviations could be attributed to seasonal variability, sampling composition (e.g., inclusion of juveniles), or localized ecological pressures, including food availability or fishing intensity during the sampling periods. Overall, although the b values reported in Table 3 are largely within acceptable biological limits and align with existing literature, the significantly low value observed in Lutjanus russellii underscores the importance of further investigation. Long-term or seasonal monitoring would help determine whether such patterns are consistent or transient. These deviations may serve as early indicators of environmental disturbance or anthropogenic impact, highlighting the value of LWR analysis as a tool for evaluating fish population health and habitat quality.
5. CONCLUSION
This study confirms that otolith shape descriptors (BDP–ShI) combined with Linear Discriminant Analysis (LDA), effectively differentiate five marine fish species from Lang Co – Hai Van, with classification accuracy ranging from 84.78% to 100%. MANOVA results revealed clear morphological distinctions, especially for Lutjanus russellii, while partial overlaps were observed between Gerres filamentosus and Selar crumenophthalmus.
Linear regression models showed strong correlations between otolith dimensions (particularly height and area) and fish body size (total length and weight), with most coefficients of determination (R²) exceeding 0.90. These findings highlight the predictive value of otolith metrics for assessing somatic growth and their utility in dietary studies, fisheries assessments, and archaeological reconstructions.
Length–weight relationships (LWRs) indicated positive allometry (b > 3) in Gerres filamentosus and Selaroides leptolepis, suggesting favorable growth conditions, while Sardinella gibbosa, Selar crumenophthalmus, and notably Lutjanus russellii exhibited negative allometry (b < 3), reflecting possible ecological or physiological constraints.
Among all species, Lutjanus russellii showed the widest variation in otolith-based regressions (e.g., OA–W and OP–TL) and the lowest growth exponent (b = 2.2), suggesting environmental stress potentially related to food limitation, habitat variability, or reproductive investment.
Overall, these interspecific differences likely reflect both biological traits and ecological conditions. Further studies across regions and life stages, integrating otolith metrics with indicators such as age or condition factor, would help clarify these patterns.
Acknowledgements: We would like to thank project “ST.Đ1.09/23” and the National Science and Technology Program under Program 562 (Project Code ÐTÐLCN.78/22) for their valuable support during the course of this study.
Author Contributions: Pham Tan Dung, Vu Quyet Thanh, Tran Duc Dien, Hoang Thi Ngoc Anh, Vo Thi Ha, Tran Van Huong: Conceptualization & Methodology. Pham Tan Dung, Vu Quyet Thanh: Data Curation. Pham Tan Dung, Hoang Thi Ngoc Anh, Tran Van Huong: Formal Analysis. Vu Quyet Thanh, Tran Duc Dien, Vo Thi Ha: Investigation / Experimentation. Pham Tan Dung, Vu Quyet Thanh, Tran Duc Dien: Writing - Original Draft. Pham Tan Dung, Vu Quyet Thanh, Tran Duc Dien, Hoang Thi Ngoc Anh, Vo Thi Ha, Tran Van Huong: Writing – Review & Editing. Pham Tan Dung: Supervision and Correspondence
Conflict of Interest Statement: The authors hereby confirm and declare that there are no financial, academic, personal, or institutional conflicts of interest that could have influenced the conduct or publication of this research. All authors have participated in the research process, made meaningful academic contributions, fully agreed with the content of the manuscript, and approved the final version submitted to the journal.
Funding: This research was supported by the project “ST.Đ1.09/23” and the National Science and Technology Program under Program 562 (Project Code: ÐTÐLCN.78/22).
References
2. G. Falini, S. Fermani, S. Vanzo, M. Miletic and G. Zaffino, Influence on the formation of aragonite or vaterite by otolith macromolecules, European Journal of Inorganic Chemistry, Vol. 2005, No. 1, pp. 162-167, 2005.
3. A. N. Popper, J. Ramcharitar and S. E. Campana, Why otoliths? Insights from inner ear physiology and fisheries biology, Mar. Freshw. Res., Vol. 56, No. 5, pp. 497-504, 2005.
4. S. E. Campana, Photographic atlas of fish otoliths of the Northwest Atlantic Ocean. NRC Research Press, Canadian Special Publication of Fisheries and Aquatic Sciences, 2004, No. 133.
5. J. E. Morrow, Preliminary keys to otoliths of some adult fishes of the Gulf of Alaska, Bering Sea and Beaufort Sea, Vol. 420, Tech. Rep., U.S. Dept. of Commerce, NOAA, NMFS, 1979.
6. M. J. Smale, G. Watson, and T. Hecht, Otolith atlas of Southern African Marine Fishes, Ichthyological Monographs, Vol. 1, J.L.B. Smith Institute of Ichthyology, Grahamstown, 1995.
7. D. Nolf, Otolithum piscium, in Handbook of Paleoichthyology, Vol. X, Stuttgart: Gustav Fischer Verlag, 1985, pp. 1-145.
8. C. A. Assis, The utricular otoliths, lapilli, of teleosts: their morphology and relevance for species identification and systematics studies, Scientia Marina, Vol. 69, No. 2, pp. 259-273, 2005.
9. D. S. Portnoy, J. R. Gold, Finding geographic population structure in marine fish species with high gene flow in Proc. of the 65th Gulf and Caribbean Fisheries Inst. , 2013, Vol. 65, pp. 384-389.
10. T. He, J. Cheng, J. Qin, Y. Li, and T. Gao, Comparative analysis of otolith morphology in three species of Scomber, Ichthyological Research, Vol. 65, pp. 192-201, 2018.
11. Q. T. Vu, Yu. Ph. Kartavtsev, Otolith shape analysis and its utility for identification of two smelt species, Hypomesus japonicus and H. nipponensis (Osteichthyes, Osmeridae) from the northwestern Sea of Japan with inferences in stock discrimination of H. japonicus, Russian Journal of Marine Biology, Vol. 46, No. 6, pp. 431-440, 2020.
12. C. Lin, B. D. Gracia, M.E.R. Pierotti, A.H. Andrews, K. Griswold, and A. O’Dea, Reconstructing reef fish communities using fish otoliths in coral reef sediments, PLoS ONE, Vol. 14, No. 6, 2019.
13. D. Levia, M. G. Andreoli, E. Arneri, G. Giannetti, and P. Rizzo, Otolith reading as a tool for stock identification, Fisheries Research, Vol. 20, No. 2-3, pp. 97-107, 1994
14. V. M. Tuset, I. Lozano, J. Gonzalez, J. Pertusa, and M. Garcia-Diaz, Shape indices to identify regional differences in otolith morphology of comber, Serranus cabrilla (L., 1758), Journal of Applied Ichthyology, Vol. 19, No. 2, pp. 88-93, 2003.
15. A. Bani, S. Poursaeid, and V. M. Tuset, Comparative morphology of the sagittal otolith in three species of south Caspian gobies, Journal of Fish Biology, Vol. 82, No. 4, pp. 1321-1332, 2013.
16. Y. J. Lin, K. Al-Abdulkader, Identification of fish families and species from the western Arabian Gulf by otolith shape analysis and factors affecting the identification process, Marine and Freshwater Research, Vol. 70, No. 12, pp. 1818-1827, 2019.
17. R. C. Francis, S. E. Campana, Inferring age from otolith measurements: a review and a new approach, Canadian Journal of Fisheries and Aquatic Sciences, Vol. 61, No. 7, pp. 1269-1284, 2004.
18. R. P. Rodríguez Mendoza, Otoliths and their applications in fishery science, Croatian Journal of Fisheries: Ribarstvo, Vol. 64, No. 3, pp. 89-102, 2006.
19. C. Stransky, A. G. Murta, J. Schlickeisen, and C. Zimmermann, Otolith shape analysis as a tool for stock separation of horse mackerel (Trachurus trachurus) in the Northeast Atlantic and Mediterranean, Fisheries Research, Vol. 89, No. 2, pp. 159-166, 2008.
20. J. P. Granadeiro, M. A. Silva, The use of otoliths and vertebrae in the identification and size-estimation of fish in predator-prey studies, Cybium, Vol. 24, No. 4, pp. 383-393, 2000.
21. J. T. Harvey, T. R. Loughlin, M. A. Perez, and D. S. Oxman, Relationship between fish size and otolith length for 63 species of fishes from the eastern North Pacific Ocean, Tech. Rep., U.S. Dept. of Commerce, NOAA, NMFS, 2000.
22. R. Froese and D. Pauly, FishBase, [Online]. Available: https://www.fishbase.se. [Accessed: June 6, 2023].
23. S. Kimura, H. Imamura, V. Q. Nguyen, and T. D. Pham, Fishes of Ha Long Bay, the natural heritage site in northern Vietnam, Fisheries Research Laboratory, Mie University, Shima, Japan, 2018.
24. E. Lieske, R. Myers, Coral Reef Fishes (Caribbean, Indian Ocean and Pacific Ocean including the Red Sea), Princeton, NJ: Princeton University Press, 1996.
25. T. Nakabo, Fishes of Japan with pictorial keys to the species, English Edition, Tokyo, Japan: Tokai University Press, 2002.
26. L. A. Libungan, S. Pálsson, ShapeR: An R package to study otolith shape variation among fish populations, PLoS ONE, Vol. 10, No. 3, 2015.
27. A. Agüera, D. Brophy, Use of sagittal otolith shape analysis to discriminate Northeast Atlantic and Western Mediterranean stocks of Atlantic saury, Scomberesox saurus saurus, Fisheries Research, Vol. 110, No. 3, pp. 465-471, 2011.
28. R.J.H. Beverton, S.J. Holt, A review of methods for estimating mortality rates in fish populations, with special reference to sources of bias in catch sampling, Rapp. Proc.-verb. Reun. Cons. Int. Explor. Mer, 1956, Vol. 140, pp. 67-83.
29. F. Pedregosa, G. Varoquaux, A. Gramfort, V. Michel, B. Thirion, O. Grisel, and É. Duchesnay, Scikit-learn: Machine learning in Python, Journal of Machine Learning Research, Vol. 12, pp. 2825-2830, 2011.
30. S. Seabold, J. Perktold, Statsmodels: econometric and statistical modeling with Python
31. Proceedings of SciPy Conference, 2010, Vol. 7, No. 1, pp. 92-96.
32. A. Teimori, A. Khajooei, M. Motamedi, and M.A. Hesni, Characteristics of sagittae morphology in sixteen marine fish species collected from the Persian Gulf: Demonstration of the phylogenetic influence on otolith shape, Regional Studies in Marine Science, Vol. 29, 2019.
33. B. Zorica, G. Sinovcic, and V. Cikes Kec, Preliminary data on the study of otolith morphology of five pelagic fish species from the Adriatic Sea (Croatia), Acta Adriatica, Vol. 51, No. 1, pp. 89-96, 2010.
34. P. Megalofonou, Comparison of otolith growth and morphology with somatic growth and age in young-of-the-year bluefin tuna, Journal of Fish Biology, Vol. 68, No. 6, pp. 1867-1878, 2006.
35. N. Salimi, K. H. Loh, S. K. Dhillon, and V. C. Chong, Fully automated identification of fish species based on otolith contour: using short-time Fourier transform and discriminant analysis (STFT-DA), PeerJ, Vol. 4, 2016
36. H. Mosegaard, H. Svedang, and K. Taberman, Uncoupling of somatic and otolith growth rates in Arctic char (Salvelinus alpinus) as an effect of differences in temperature response, Canadian Journal of Fisheries and Aquatic Sciences, Vol. 45, No. 9, pp. 1514-1524, 1988.
37. T. E. Laidig, S. Ralston, and J. R Bence, Dynamics of growth in the early life history of shortbelly rockfish Sebastes jordani, Fishery Bulletin, Vol. 89, pp. 611-621, 1991.
38. D. H. Secor, J. M. Dean, Somatic growth effects on the otolith–fish size relationship in young pond-reared striped bass, Morone saxatilis, Canadian Journal of Fisheries and Aquatic Sciences, Vol. 46, No. 1, pp. 113-121, 1989.
39. R. W. Blacker, Recent advances in otolith studies. Sea Fisheries Research, 1974, pp. 67-90.
40. T. Williams, B. C. Bedford, The use of otoliths for age determination, In: The Ageing of Fish. Unwin Brothers, Surrey, England, 1974, pp. 114-123.
41. I. Everson, B. Bendall, and A. Murray, Otolith and body size relationships in the Mackerel Icefish (Champsocephalus gunnari), CCAMLR Science, Vol. 6, pp. 117-123, 1999.
42. D.J. Tollit, M.J. Steward, P.M. Thompson, G.J. Pierce, M.B. Santos, and S. Hughes, Species and size differences in the digestion of otoliths and beaks: implications for estimates of pinniped diet composition, Canadian Journal of Fisheries and Aquatic Sciences, Vol. 54, No. 1, pp. 105-119, 1997.
43. M. I. Baldas, G. Perez Macri, A. V. Volpedo, and D.D. Echeverria, Morfología de la Sagitta de peces marinos de la costa bonaerense de la Argentina I: Carangidae, Sciaenidae, Mullidae, Atlantica, Rio Grande, Vol. 19, pp. 99-112, 1997.
44. L. Mauco, M. Favero, and M. S. Bo, Food and feeding of the common tern (Sterna hirundo) in Samborombón Bay, Buenos Aires, Argentina, Waterbirds, Vol. 24, No. 1, pp. 89-96, 2001.
45. B. J. Cardinale, A. R. Ives, and P. Inchausti, Effects of species diversity on the primary productivity of ecosystems: extending our spatial and temporal scales of inference, Oikos, Vol. 104, No. 3, pp. 437-450, 2004.