SOME HEMATOLOGICAL CHARACTERISTICS OF RED DRUM Sciaenops ocellatus IN AN EXPERIMENTAL FRESHWATER CULTURE ENVIRONMENT USING NATURAL FEED
Institute of Tropical Ecology, Joint Vietnam-Russia Tropical Science and Technology Research Center
No. 63 Nguyen Van Huyen, Nghia Do, Cau Giay, Hanoi.
Phone: +84989106174; Email: dhquyet@gmail.com
Main Article Content
Abstract
This study presents the results of some hematological characteristics of the red drum (Sciaenops ocellatus) reared in freshwater tanks and fed a diet consisting of trash fish. Blood samples were collected, cell counts performed, and blood smears, as well as biochemical indices, were analyzed on days 1, 5, 10, and 20 of the experiment. Standard hematological research methods were employed. The water concentrations of several heavy metals were also assessed. The results indicate that red drum showed limited adaptation to the freshwater environment and a natural trash fish diet, with a mortality rate reaching 28% during the 28-day experimental period. The red blood cell count increased by 48% to 81% on day 10 compared to days 1 and 5. Morphological abnormalities in red blood cell membranes were observed in blood samples on day 20. Most biochemical indices remained relatively stable throughout the experiment, except for creatinine, which decreased on days 10 and 20 compared to days 1 and 5. The data obtained also contribute to the reference ranges in the hematological profile of red drum.
Keywords
Red drum, biochemical, hematology, heavy metals, freshwater, cá hồng mỹ, sinh hóa, huyết học, kim loại nặng, nước ngọt.
Article Details
1. INTRODUCTION
The red drum Sciaenops ocellatus is one of the most popular euryhaline fish species [1, 2], with a fast growth rate, delicious meat, high nutritional value, and good resistance to changes in temperature during the long cold winters of Northern Vietnam. Red drum were once farmed in many provinces in Vietnam such as Hai Phong, Quang Ninh, Nam Dinh, Nghe An [3], Thanh Hoa, Ha Tinh, and Khanh Hoa [4].
Fish blood is similar to that of other animals, reflecting the body's health status as well as the quality of the environment in which the fish lives [5, 6]. There are many studies related to the hematological profile of red drum [7-9]; however, in the majority of studies, red drum are collected/farmed in coastal saltwater environments or estuary areas where there are many objective factors that cannot be controlled such as temperature, pH, and content of inorganic and organic substances.
In 2013, Gullian-Klanian [10] conducted experimental research on raising red drum in freshwater conditions. The findings showed changes in physiological osmotic pressure as well as the important role of ion treatment during fish farming. However, this study did not examine in detail the red drum's blood profile as well as the changes in their biochemical indicators. Therefore, our study was conducted to evaluate the effects of freshwater farming conditions and feed ingredients prepared from wild trash fish species on hematological profiles, including blood cell composition, morphological characteristics as well as biochemical indicators, of red drum in Ha Tinh, Vietnam.
2. SUBJECTS AND METHODS
2.1. Experimental design
The experiment was conducted from February 17 to April 5, 2022, in Ky Ninh commune, Ky Anh town, Ha Tinh province. Fifty individuals of red drum with an average weight of 1.0 ± 0.25 kg purchased at a local fish farm were placed in a water tank with an initial salinity of 26‰, with dimensions of length x width x height of 2.0 x 2.0 x 1.4 m. The actual water volume was approximately 4.6 m³. Water changes were performed daily to reduce salt level from 26‰ to 0‰ after 5 days. The rate of salinity reduction was based on the Gullian-Klanian method [10]. A 200 W air blower was used (model ACO-012, China) with 4 spherical air stones operating full time in the experiment.
The fish were fed every day at 8:30 am and 5:00 pm. The feed was made from trash fish species of the Scad genus. To ensure consistency in feed ingredients, trash fish was purchased at a time (20 kg) from a trader at river mouth Cua Khau, Ky Ninh, Ky Anh, Ha Tinh, and frozen at a temperature of -14°C to -10°C. Before each feeding, the trash fish was cut with scissors into pieces measuring 1-2 cm x 2-3 cm. The weight for each feeding was usually equivalent to 1-3% of the total weight of fish in the tank and was gradually decreased after each sampling. Random analysis of a feed sample showed that the ingredients for 100 g of feed included crude protein 17.5%, fat 3.92%, crude fiber 0.33%, phosphorus 750 mg/100 g, and calcium 1.03 g (analyzed at the National Institute for Food Control, No. 65 Pham Than Duat Street, Mai Dich, Cau Giay, Hanoi).
The water in the tank was changed every two days, the volume of water replaced corresponding to 1/3 of the total amount of water in the tank water changes were performed using a submersible pump and dragged along the bottom to remove feed debris and fish waste. The fish tank was situated in the courtyard, under a canopy of trees and half covered with a corrugated iron roof.
Water parameters such as temperature, pH, and dissolved oxygen were measured directly in the field using a Multi-Parameter Analyzer AZ 86031 (AZ Instrument Corp., Taiwan).
2.2. Collection of fish blood and water samples
On days 1, 5, 10, 20, and 23, from the time the water salinity in the tank reached 0-1‰, blood was taken from the tail vein with heparin, an anticoagulant, at a ratio equivalent to 1 ml blood: 1 drop of heparin concentration 500 IU, mixed with physiological saline solution for freshwater fish [11]. The blood was taken no more than 2 minutes after the fish was taken out of the tank to minimize the effects of stress on the fish. For each fish, 4 ml was taken, of which 2 ml was for biochemical analysis and 2 ml was for cell count and blood smear.
On days 1, 10, and 20, three water samples were collected, marked, and sent to the laboratory at the Joint Vietnam-Russia Tropical Science and Technology Research Center.
2.3. Analysis of blood biochemical indicators and heavy metal content in water
Tubes containing blood samples used for biochemical analysis were placed in a blood transport cooler, stored at a temperature of 4 -8oC, and transported to the laboratory within 2 hours after sampling.
The hemoglobin content was analyzed using an Auto Hematology Analyzer BC-2800 (Mindray, China). The remaining parameters, glucose, urea, creatinine, triglyceride, aspartate transaminase (AST), and alanine transaminase (ALT), were analyzed using an Olympus AU400 Automated Clinical Chemistry Analyzer (Japan).
The heavy metal content in the water was analyzed with an inductively coupled plasma mass spectrometry system, using method SMEWW 3125B: 2017. Indicators of interest include Cr, Fe, As, Mn, Hg, Ni, Cd, Mg, Zn, Cu, and Pb.
2.4. Counting the number of red blood cells, blood smear preparation and measure cell size
Using a silver-coated Neubauer counting chamber and an Amscope microscope (M158C-E, USA) with a camera connected to a computer, the number of red blood cells was counted after diluting the blood 250 times with physiological solution.
Red drum blood smears were prepared similarly to those of human or other animal blood, following the method described by Greer [12].
After preparing the smears, the slides were air-dried. Cells were fixed on the slides with 100% methanol for three minutes, then stained with 5% Giemsa solution for 20 minutes using a manual staining tray. The slides were rinsed twice with pH 7.2 buffer solution, each time for one minute, and allowed to dry naturally in the air.
Detailed studies and photography were conducted using an Olympus CX33 optical microscope (Japan) at the laboratory of the Institute of Tropical Ecology, Joint Vietnam-Russia Tropical Science and Technology Research Center.
The length, width, and area of erythrocytes, as well as the length, width, and area of erythrocyte nuclei, were measured using ImageJ software version 1.54.
2.5. Image processing and statistical analysis
Images were processed to increase contrast using Photoshop CS6 software and to increase resolution using free online image-processing AI tools such as zyro.com, picwish.com, and pixelcut.ai. There was no intervention related to the content or composition of the blood smear images.
The obtained data were statistically processed using IBM SPSS Statistics 26 software. Results are presented as Mean ± Standard Deviation. The Kruskal-Wallis test and Dunn’s test were run for biochemical test results. The ANOVA test was applied to red blood cell morphology data with a large amount of data, satisfying the condition that the sample has a normal distribution. Statistically significant differences are mentioned with p value ≤ 0.05.
3. RESULTS AND DISCUSSION
3.1. Water parameters under experimental conditions
The results of the analysis of temperature, pH, dissolved oxygen, and some heavy metals in the agricultural environment at the specified times are shown in Table 1.
Table 1. Water quality during the experiment
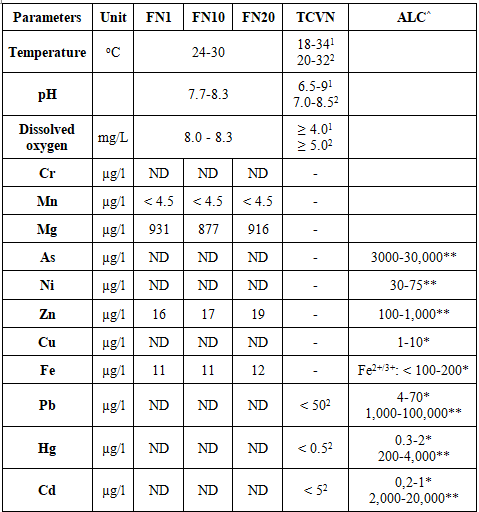
Note: FN1, FN10, FN20 - freshwater samples taken on days 1, 10, and 20 of the experiment; ND - not detected; TCVN - Vietnamese National Standards; 1 - TCVN 13952:2024, Water for aquaculture-Freshwater-Quality Requirements; 2 -TCVN 13951:2024, Water for aquaculture-Marine water-Quality Requirements; ALC: maximum permissible concentration; ^ - Svobodová et al. [13]; * - Acceptable limitations in aquaculture, **Lethal concentrations, which vary depending on other factors such as species, inorganic and organic compounds, soft water, and calcium-rich water etc.
In Vietnam, currently, there is no Technical Regulation on Freshwater Quality for Aquaculture; and likewise Vietnamese National Standard TCVN 13952:2024 [14] has note yet established critical values for heavy metals. But in the Vietnamese National Standard TCVN 13951:2024 [15] only regulates the concentration limits of three metals considered the most toxic: Pb, Hg, and Cd. However, the obtained values indicate that the experimental environmental conditions align with existing standards for fish farming concerning physicochemical indicators.
3.2. Mortality rate of experimental fish
The original plan was to collect fish blood on days 1, 5, 10, 20, and 30 of the experiment. However, we were not able to take blood from red drum individuals on day 30 as originally planned. Starting from the 12th day, scattered dead red drum appeared. Table 2 presents details of fish deaths and dates of events.
Table 2. Events that occurred during the experiment
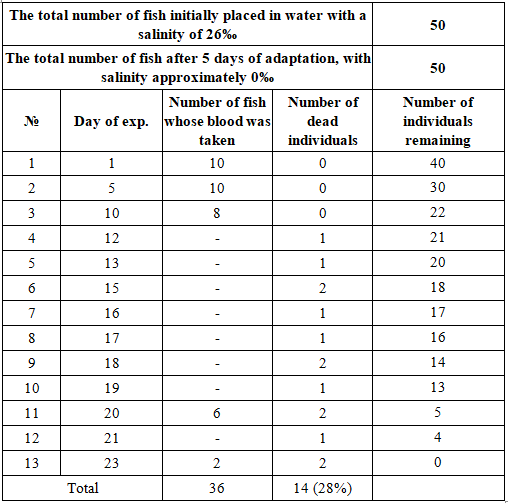
The last day of blood collection was on the 23rd day of the experiment. The mortality rate of red drum went up to 28% during the 28-day period, including the first 5 days before blood collection. During the entire experiment, 14 out of 50 fish died, despite being provided with adequate feed and regular water changes, and despite the researchers ensuring dissolved oxygen as well as very low heavy metal content in the water. This shows that red drum is not fully adapted to the freshwater environment. This result is similar to the red drum farming experiment conducted by Gullian-Klanian in 2013 [10], where, during the 8-day period of reducing salinity from 30 psu to 0 psu, no deaths of red drum were recorded. However, during commercial freshwater culture, the fish mortality rate is as high as 42.5%. The cause of fish mortality is believed to be related to low osmotic pressure with a decrease in plasma K+ ion concentration. Our experimentally raised red drum did not have enough K+ ion concentration in the plasma to ensure osmotic pressure balance with the environment. This result is also consistent with the data and research results presented by Sakamoto and Yone [16] and Shearer [17].
For red drum to be able to live in environments with varying salinities, they must be able to maintain relatively stable plasma ion concentrations when living for long periods of time in extremely low-salinity environments [10]. Some authors [18, 19] have suggested that, for euryhaline fish species, both hematological and osmotic values do not change significantly when exposed to different salinity conditions. However, during the research process, we found that, to dilute the blood of red drum raised in saltwater and freshwater environments, it is necessary to use physiological salt solution for marine or freshwater fish. Using inappropriate physiological saline solutions can cause hemolysis. It is also important to emphasize that freshwater environments have lower osmotic pressure as well as lower solute composition than saltwater ones [10]. When changing water, the osmotic pressure of the external environment gradually decreases (changing salinity from 26‰ to about 0‰), whereas, for fish to maintain life, the osmotic pressure of the extracellular fluid must ensure balance with the water environment through the main ions K+ and Ca2+ - meaning the osmotic pressure of extracellular fluid also decreases [10]. At the same time, the blood cell membrane must have a mechanism to stabilize and keep water moving in a controlled manner into the cell. A decrease in plasma osmolality in a freshwater environment should not necessarily be interpreted as an inability to tolerate a hypotonic environment.
3.3. Morphological characteristics of blood cells
Figure 1 shows the results of the analysis of whole blood samples and recorded components including red blood cells, neutrophils, basophils, small and large lymphocytes, platelets, and monocytes. No eosinophils were recorded.
In this study, the erythrocyte cytoplasm of red drum exhibited a lightly basophilic blue color when stained with Giemsa stain (Merck, Germany). In contrast, with Quik-DipStain (Mercedes Medical, Inc., 7590 Commerce Court, Sarasota, FL, USA), the cytoplasm was reported to be slightly basophilic [8]. White blood cells and red blood cells of the same fish species do not always exhibit the same color after staining, despite being classified as the same cell type. This discrepancy is thought to be related to pH differences in the cells, as well as variations in the processing and staining methods [8]. In previous research [9], no eosinophils were recorded in the blood of red drum. Harr et al. [8] recorded 4/33 red drum individuals with low numbers of cells consistent with the characteristics of eosinophils, while basophils were not observed. The different results between this study and that of Harr et al.[8] highlight the difficulty of classifying leukocyte types [20], partly due to the non-specific role of granulocytes in fish, which is similar to that in higher animals such as mammals or humans [21]. Furthermore, the images obtained through microscopy are influenced by many objective factors, including dyes, purity, laboratory equipment, and subjective factors such as technician actions and investigator judgment [22].
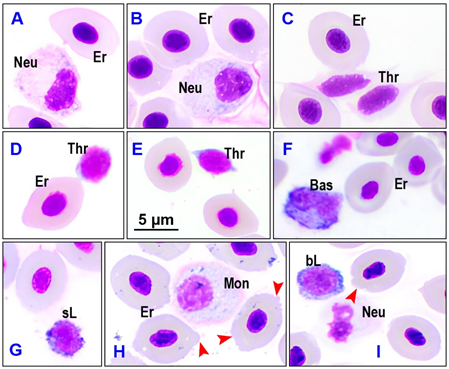
Figure 1. Types of red drum blood cells in freshwater culture conditions using natural feed. Er - erythrocyte, Neu - neutrophil, Thr - thrombocyte, Bas - basophil, sL - small lymphocyte, Mon - monocyte, bL - large lymphocyte. A, B, C - FN1; D, E - FN5; F, G - FN10; H, I - FN20 (FN1, FN5, FN10, FN20-fish blood samples in freshwater condition and using natural feed on days 1, 5, 10, and 20 of the experiment)
Table 3 presents the size of red blood cells of fish groups measured at each sampling date. The results show that red blood cell size of red drum decreased significantly on day 5 of the experiment in all indicators, followed by an increase on day 10. Smith [23] reported that erythrocyte size varies inversely with the metabolic activity of animals. Szarski [24] noted that red blood cell size has adaptive value, and any adaptive decrease in metabolic rate tends to an increase in cell size. Changes in hematological parameters can be verified not only across different species but also within the same species in varying ecological niches, resulting in physiological adaptation [25]. The number of studies focusing on changes in red blood cell size or shape is limited, making comparisons challenging [26]. Red blood cell size, including surface area or volume, is inversely proportional to the ratio of oxygen bound to hemoglobin [27]. Our research results indicate that hemoglobin content remained stable during the experimental period (see Table 4), and the dissolved oxygen level in the culture environment was well maintained. Thus, the observed fluctuations in red blood cell morphological indices from day 1 to day 20 appear to be related to the fish's efforts to cope with stress induced by the differences in osmotic pressure. This unresolved situation likely contributed to the high mortality rates, as shown in Table 2.
Table 3. Morphological indices of red blood cells of red drum in the experiment
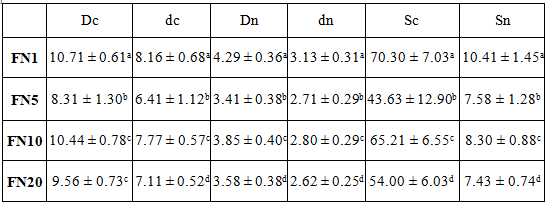
Note: Dc, dc, Sc - large diameter, small diameter, and area of RBC; Dn, dn, Sn - large diameter, small diameter, and area of nucleus; FN1, FN5, FN10, FN20 - fish blood samples in freshwater condition and using natural feed on days 1, 5, 10 and 20 of the experiment; Kruskal-Wallis test and Dunn's test, a, b, c, d, e - statistically significant differences in column (p ≤ 0.05).
With blood samples collected from fish groups FN1, FN5, and FN10, no red blood cell disorders were recorded at a level considered to require attention. However, with the FN20 fish group, red blood cell membrane structural disorders were clearly evident (red blood cells in figures 1-H, 1-I with red arrowhead). Prolonged stress causes the stability of the red blood cell membrane structure to gradually break down, creating wrinkles at the cell poles. In 2019, red blood cells of red drum in the saltwater environment at the estuary, also in this area, were recorded to have many morphological disorders related to shape and nuclear structure [9], while in the freshwater environment of this experiment, there were almost none. Combined with previous research results [9], it can be seen that, for red drum, disorders in red blood cell nuclei are largely due to the effects of heavy metals in the water.
3.4. Hematological and biochemical indices of red drum
In addition to the research results on the composition and characteristics of blood cells, biochemical data of red drum blood under experimental freshwater conditions were also analyzed (Table 4).
Table 4. Blood cell composition and biochemical indicators
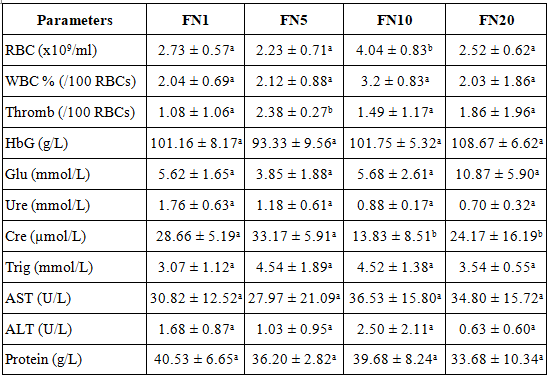
Note: FN1, FN5, FN10, FN20 - fish blood samples in freshwater condition and using natural feed on days 1, 5, 10, and 20 of the experiment; RBC - red blood cell or erythrocyte; WBC - white blood cell or leucocyte; Thromb - thrombocyte or platelet; HbG - hemoglobin; Glu - glucose; Cre - creatinine; Trig - triglyceride; AST - aspartate aminotransferase; ALT - alanine aminotransferase.
Hematological parameters of fish, such as red blood cells (RBC), white blood cells (WBC), platelets, and hemoglobin, are influenced by various factors. Among these, the number of RBCs in fish is significantly dependent on environmental factors, primarily temperature and dissolved oxygen levels in the water [6]. Typically, fish respond to hypoxic conditions by increasing their oxygen storage capacity in the blood, accelerating erythropoiesis, and rapidly releasing stored cells from the spleen [28], while also increasing cell surface area [27]. An increase in RBC count has been observed in environments with higher temperatures [29, 30]. Research by Ghanbari et al. [31] indicated that acidic (pH 5.5) or alkaline (pH 9.0) water conditions significantly reduce RBC levels in Cyprinus carpio carp, while Chindah et al. [32] found that in Sarotherodon melanotheron tilapia, RBC levels increased significantly in water with a pH of 4-6 compared to neutral pH conditions. The marked increase in red blood cell index on day 10 may be one of the immune system's efforts to increase the transport of energy, nutrients, and ions to enhance the ability to resist stress [6].
Regarding white blood cells (WBC), which play a crucial role in the immune system, their numbers are influenced by various factors, including internal factors such as gender, stress, feeding habits, and illness, as well as external factors like seasons and water pollution [33]. Fazio et al.'s experiments [34] on the gilthead seabream, a euryhaline species similar to red drum, demonstrated that stress resulted in increased RBCs, hemoglobin, WBCs, and glucose levels in the fish.
The third type of cell considered in this study is platelets, which are critical for the blood clotting process-a protective response of organisms. Numerous studies have shown a correlation between platelet count and stress in fish, indicating that the activation of hemostasis mechanisms following a period of stress is accompanied by an increase in platelet numbers [35-37]. In this study, temperature, pH, and dissolved oxygen (DO) levels were found to be suitable for the living conditions of red drum [2, 38]. Thus, the changes in hematological indices observed at different time points during the experiment suggest a relationship with the stress conditions induced by the freshwater environment.
Biochemical indexes such as glucose, urea, creatinine, triglyceride, AST, ALT, and plasma protein were quite stable throughout the experiment, and differences between experimental times were not statistically significant.
Glucose is a critical indicator reflecting nutritional status and energy metabolism in animals. In many cases, when fish experience stress, stress hormones, in conjunction with cortisol, mobilize and increase glucose production through gluconeogenesis and glycogenolysis pathways [39] to meet the energy demands caused by stressors, triggering a "fight or flight" response. Although some researchers suggest that glucose is a useful indicator for determining the stress level of fish under multiple stressors [40], many authors, including Mommsen et al. [41] and Flodmark et al. [42] emphasize the need for careful consideration when using glucose as the sole indicator of stress. In such a state, Davis and McEntire [43] reported weak or no glucose increase, while Rotllant and Tort [44] noted no change, and even a decrease was observed in Wood et al.'s study [45]. In this study, fish groups exposed to freshwater (salinity 0‰) exhibited fluctuations in glucose levels across sampling times, with a marked increase at the end of the experiment, from 5.62 ± 1.65 mmol/L on day 1 to 10.87 ± 5.90 mmol/L on day 20. These values were lower than those observed in red drum fish reared in sea cages with salinity levels between 24-36‰, where glucose levels ranged from 12.31 ± 0.67 to 17.03 ± 1.02 mmol/L [9]. However, data analysis in Table 4 indicated that the differences were not statistically significant, and the standard deviation exhibited a wide margin. This could be attributed to the sample size in each group being only representative (6 ≤ n ≤ 10) and/or individual variations in red drum's stress response.
The analysis of urea and creatinine levels allows for certain assessments regarding the functioning of the liver, kidneys, or gills in fish. These organs play a critical role in maintaining homeostasis and regulating osmotic effects. Freshwater fish typically drink very little water, tend to lose salts to their environment, which must be replaced, and their kidneys excrete large amounts of water to counterbalance water absorption through the skin. In contrast, marine fish consume large amounts of water and excrete salt through specialized cells in their gills. Euryhaline species such as salmon or red drum can employ both mechanisms, depending on whether they are living in freshwater or saltwater environments at a given time [46]. Furthermore, there are cellular-level adaptations within the fish, involving active and passive transport proteins that facilitate the movement of salts along or against concentration gradients. In this study, a notable point is that creatinine content decreased sharply on day 10 then increased again on day 20. As is known, creatinine is a waste product of protein breakdown in feed as well as from normal breakdown in muscle tissue. Creatinine levels are often reported to increase in cases of stress owing to heavy metal exposure [47] or transportation [48]. However, our research results show that reduced creatinine concentrations can also be a consequence of prolonged stress, impacting the fish's ability to consume feed as well as reducing muscle tissue activity. The amount of waste products produced also decreases accordingly. Creatinine values at stages with large standard deviations show that there are significant fluctuations in creatinine content in fish blood, and even significant differences between individuals under the same farming conditions.
Triglycerides represent one of the energy substrates derived from fats, serving as a crucial component necessary to provide energy for fish. They are also a useful tool for assessing nutritional status and lipid metabolism in freshwater fish. Fluctuations in triglyceride concentrations can indicate the onset of certain pathological conditions, such as nephrotic syndrome or glycogen storage disease, or may be caused by stress from toxic compounds in the water [49]. The triglyceride level has been observed to increase in Oreochromis niloticus when exposed to silver but decrease when exposed to copper [50]. However, there may be no significant change when the diet of Cyprinus carpio shifts from fry to plant protein [51]. Typically, plasma triglyceride levels in carp range from 1.36 to 1.53 mmol/L [47], while in Australian snapper Pagrus auratus, they range from 0.9 to 5.2 mmol/L [52]. Meanwhile, specific studies on blood triglyceride levels in red drum are scarce; thus, the values obtained in this experiment may serve as reference data for future studies.
Two enzymes-aspartate aminotransferase (AST) and alanine aminotransferase (ALT)-are commonly used to evaluate liver damage or dysfunction [53]. When liver injury occurs, both enzymes are released into the blood, and in cases of severe injury, AST levels rise and remain elevated for several days [54]. Both enzymes are found in low concentrations in the blood of healthy fish [55]. In seawater environments containing certain permissible heavy metal ions, the AST levels of red drum have been recorded at 18.66-76.22 U/L, while ALT levels range from 2.71 to 22.40 U/L [9]. AST and ALT levels vary significantly between species and even within the same species. For example, these indicators in red drum are significantly lower compared to tilapia, where AST ranges from 47.43 to 125.17 U/L and ALT from 12.56 to 25.06 U/L [55]; meanwhile, rainbow trout AST levels are relatively high, ranging from 181.73 to 370.47 U/L, and ALT ranges from 0.78 to 4.78 U/L [49]. In this study, the levels of these enzymes also fell within previously reported ranges, and throughout the experiment, no significant differences were observed across blood sampling times. Therefore, under the experimental conditions presented, there were no signs of liver damage or dysfunction in red drum.
Plasma proteins are another key biochemical parameter for assessing fish health and the biological mechanisms of metabolism under pollution pressure [5, 47]. In this study, total protein levels ranged from 23.34 to 47.92 g/L, with no statistically significant differences observed between sampling times. Compared to previous studies in estuarine areas with higher salinity levels (above 30‰), total plasma protein in red drum has been recorded at 42.04-71.87 g/L [9]. Living entirely in marine conditions, Pagrus auratus exhibits plasma protein levels ranging from 36 to 69 g/L [52]. Fish can utilize various metabolic substrates for energy to maintain osmoregulation, including amino acids and proteins. Elevated plasma amino acid levels have been observed in fish inhabiting high-salinity environments [56]. Some authors [57] suggest that in certain euryhaline fish species, adapting to low-salinity water requires less energy than to high-salinity conditions, possibly due to lower demands for soluble amino acids and proteins to maintain osmotic balance in low-salinity environments. However, Mian and Siddiqui [58] reported that hybrid tilapia (Oreochromis mossambicus × Oreochromis niloticus) fed a diet containing 30-40% protein and living in water with salinity levels ranging from 0 to 35‰ maintained stable plasma protein levels of 9.0-9.2 g/L, which is relatively low compared to red drum. Changes in total protein content are likely to occur when fish transition between low- and high-salinity environments.
4. CONCLUSION
Based on the results of this study, it is evident that red drum Sciaenops ocellatus showed poor adaptation to the freshwater environment over a long period, with a mortality rate of up to 28% during the 28-day experiment. Under conditions where the concentrations of heavy metals Fe, Mn, and Zn is below the threshold of 0.02 mg/L, Mg is below 1 mg/L, and no Cr, As, Hg, Ni, Cd, Cu, or Pb were detected, no red blood cell disorders related to cell nuclei were recorded.
The morphological and biochemical changes in erythrocyte indices in this study highlight the diversity of the red drum’s cellular responses to freshwater conditions. Under the same living environment and diet, individual red drum exhibit variations in their reactions to surrounding conditions as they strive to maintain homeostasis within their bodies. The data collected also reinforce the reference ranges within the blood profile of red drum.
Acknowledgement: This research was conducted within the framework of the project: "Research on hematological characteristics of red drum (Sciaenops ocellatus) raised in cages in Ha Tinh under nutritional conditions and the natural and artificial environment." Funding was provided by the Joint Vietnam-Russia Tropical Science and Technology Research Center, Decision No. 3745/QĐ-TTNĐVN from 15/10/2021.
References
2. Nguyễn Cao Doanh, Kỹ thuật sản xuất giống và nuôi cá hồng mỹ, Nhà xuất bản Nông nghiệp, Hà Nội, 2005, 24 tr.
3. Trương Thị Thành Vinh, Nguyễn Đình Vinh, và Trần Đình Quang, Ảnh hưởng của mật độ nuôi đến tỷ lệ sống và tăng trưởng của cá hồng mỹ (Sciaenops ocellatus) nuôi thương phẩm trong ao đất, Tạp chí Khoa học và Công nghệ Việt Nam, 2017, 15(4):55-58.
4. Quyet D.H. and Dung P.T., Morphological alterations of fish erythrocytes as their response to environmental conditions, HAYATI Journal of Bioscience, 2023, 30(4):711-715. DOI:10.4308/hjb.30.4.711-715
5. Rudneva I.I., Skuratovskaya E.N., Dorohova I.I. and Kovyrshina T.B., Use of fish blood biomarkers for evaluation of marine environment health, World Journal of Science and Technology, 2012, 2(7):19-25.
6. Witeska M., Erythrocytes in teleost fishes: a review, Zoology and Ecology, 2013, 23(4):275-281. DOI:10.1080/21658005.2013.846963
7. Bourtis C.M., Francis-Floyd R., Boggs A.S.P., Reyier E.A., Stolen E.D., Yanong R.P., and Guillette Jr. L.J., Plasma glucose levels for red drum Sciaenops ocellatus in a Florida estuarine fisheries reserve, Florida Scientist, 2015, 78(2):88-93.
8. Harr K.E., Deak K., Murawski S.A., Reavill D.R., and Takeshita R.A., Generation of red drum (Sciaenops ocellatus) hematology Reference Intervals with a focus on identified outliers, Veterinary Clinical Pathology, 2018, 47(1):1-7. DOI:10.1111/vcp.12569
9. Quyet D.H., Blood cells and some hematological parameters of red drum (Linnaeus, 1766) in Vietnam, Brazilian Journal of Biology, 2022, 82:1-7. DOI:10.1590/1519-6984.237283
10. Gullian-Klanian M., Physiological changes in the red drum after long-term freshwater acclimation, Journal of Aquatic Animal Health, 2013, 25:131-141. DOI:10.1080/08997659.2013.788582
11. Hoar W.S., and Hickman C.P., A laboratory companion for general and comparative physiology, 2nd ed., Englewood Cliffs, Prentice-Hall, 1975.
12. Greer J.P., Rodgers G.M., Glader B., Arber D.A., Means R.T., List A.F., Appelbaum F.R., Dispenzieri A., and Fehniger T.A., Wintrobe’s clinical hematology, 14th ed., Philadelphia, Wolters Kluwer, 2019, 7187 p.
13. Svobodová Z., Lloyd R., Machova J., and Vykusova B., Water quality and fish health, EIFAC Technical Paper. No. 54, Research Institute of Fish Culture and Hydrobiology, Editor FAO: Rome, 1993.
14. TCVN 13952:2024 - Nước nuôi trồng thủy sản - Nước ngọt - Yêu cầu chất lượng, 2024.
15. TCVN 13951:2024 - Nước nuôi trồng thủy sản - Nước biển - Yêu cầu chất lượng, 2024.
16. Sakamoto S., and Yone Y., Requirement of Red Sea Bream for dietary Na+ and K+, Journal of the Faculty of Agriculture, Kyushu University, 1978, 23:79-84. DOI:10.5109/23680
17. Shearer K.D., Dietary potassium requirement of juvenile Chinook Salmon, Aquaculture, 1988, 73:119-129. DOI:10.1016/0044-8486(88)90047-6
18. Madsen S.S., Larsen B.K., and Jensen F.B., Effects of freshwater to seawater transfer on osmoregulation, acid-base balance and respiration in river migrating whitefish (Coregonus lavaretus), Journal of Comparative Physiology B, 1996, 166:101-109. DOI:10.1007/BF00301173
19. Tort L., Landri P., and Altimiras J., Physiological and metabolic changes of Sea Bream Sparus aurata to short-term acclimation at low salinity, Comparative Biochemistry and Physiology, 1994, 108A:75-80. DOI:10.1016/0300-9629(94)90057-4
20. Hine P.M., The granulocytes of fish, Fish & Shellfish Immunology, 1992, 2:79-98. DOI:10.1016/S1050-4648(05)80038-5
21. Ellis A.E., Non-specific defense mechanisms in fish and their role in disease processes, Developments in Biological Standardization, 1981, 49:337-352.
22. Witeska M., Kondera E., Ługowska K., and Bojarski B., Hematological methods in fish - Not only for beginners, Aquaculture, 2022, 547:1-17. DOI:10.1016/j.aquaculture.2021.737498
23. Smith H.M., Cell size and metabolic activity in amphibia, The Biological Bulletin, 1925, 48:347-378. DOI:10.2307/1536602
24. Szarski H., Changes in the amount of DNA in cell nuclei during vertebrate evolution, Nature, 1970, 226:651-652. DOI:10.1038/226651a0
25. Campbell T.W., and Murru F., An introduction to fish hematology, Compendium on Continuing Education for the Practicing Veterinarian, 1990, 12:525-532.
26. Dal’Bó G.A., Sampaio F.G., Losekann M.E., de Queiroz J.F., Luiz A.J.B., Wolf V.H.G., Gonçalves V.T., and Carra M.L., Hematological and morphometric blood value of four cultured species of economically important tropical foodfish, Neotropical Ichthyology, 2015, 13(2):439-446. DOI:10.1590/1982-0224-20140115
27. Holland R.A.B., Factors determining the velocity of gas uptake by intracellular hemoglobin, in Blood Oxygenation, E.D. Hershey, Editor Springer: Boston, MA., 1970, p.1-23. DOI:10.1007/978-1-4684-1857-6_1
28. Houston A.H., Roberts W.C., and Kennington J.A., Hematological response in fish: pronephric and splenic involvements in the goldfish, Carassius auratus L., Fish Physiol. Biochem., 1996, 15:481-489. DOI:10.1007/BF01874922
29. Sopińska A., Effects of physiological factors, stress, and disease on haematological parameters of carp, with a particular reference to leukocyte pattern. I. Variability of haematological indices of carp in relation to age and gonad maturity stage, Acta Ichthyologica et Piscatoria, 1983, 13:59-81. DOI:10.3750/AIP1983.13.2.04
30. Svetina A., Matasin Z., Tofant A., Vucemilo M., and Fijan N., Haematology and some blood chemical parameters of young carp till the age of three years, Acta Veterinaria Hungarica, 2002, 50:459-467. DOI:10.1556/AVet.50.2002.4.8
31. Ghanbari M., Jami M., Domig K.J., and Kneifel W., Long-term effects of water pH changes on hematological parameters in the common carp (Cyprinus carpio L.), African Journal of Biotechnology, 2012, 11:3153-3159. DOI:10.5897/ajb10.1244
32. Chindah A.C., Braide A.S., and Oranye O., Response of Sarotherodon melanotheron Ruppell (1852) in the Niger Delta Wetland, Nigeria to changes in pH, Revista Cientifica Universidad De Oriente Agricola, 2008, 8:143-153.
33. Ahmed I., Reshi Q.M., and Fazio F., The influence of the endogenous and exogenous factors on hematological parameters in different fish species: a review, Aquaculture International, 2020, 28:869-899. DOI:10.1007/s10499-019-00501-3
34. Fazio F., Ferrantelli V., Fortino G., Arfuso F., Giangrosso G., and Faggio C., The influence of acute handling stress on some blood parameters in cultured sea bream (Sparus aurata Linnaeus, 1758), Italian Journal of Food Safety, 2015, 4:4174. DOI:10.4081/ijfs.2015.4174
35. Casillas E., and Smith L.S., Effect of stress on blood coagulation and haematology in rainbow trout (Salmo gairdneri), J. Fish. Biol., 1977, 10:481-491. DOI:10.1111/j.1095-8649.1977.tb04081.x
36. Fujikata A., and Ikeda Y., Effect of handling on blood coagulation in carp, Nippon Suisan Gakk, 1985, 51:1093-1096.
37. Hattingh J., and Van Pletzen A.J.J., The influence of capture and transportation on some blood parameters of fresh water fish, Comp. Biochem. Physiol. Physiol., 1974, 49:607-609. DOI:10.1016/0300-9629(74)90573-8
38. FAO, Sciaenops ocellatus, in Cultured aquatic species fact sheets, Valerio Crespi & Michael New, Editors, 2009.
39. Iwama G.K., Vijayan M.M., Forsyth R.B., and Ackerman P.A., Heat shock proteins and physiological stress in fish, American Zoologist, 1999, 39:901-909. DOI:10.1093/icb/39.6.901
40. Donaldson E.M., The pituitary-interrenal axis as an indicator of stress in fish, in Stress and Fish, A.D. Pickering, Editor Academic Press: New York., 1981, p.11-47.
41. Mommsen T.P., Vijayan M.M., and Moon T.W., Cortisol in teleosts: dynamics, mechanisms of action, and metabolic regulation, Reviews on Fish Biology and Fisheries, 1999, 9:211-268. DOI:10.1023/A:1008924418720
42. Flodmark L.E.W., Urke H.A., Helleraer J.H., Arnekleiv J.V., Vøllestad L.A., and Poléo A.B.S., Cortisol and glucose responses in juvenile brown trout subjected to a fluctuating flow regime in an artificial stream, Journal of Fish Biology, 2001, 60:238-248. DOI:10.1111/j.1095-8649.2002.tb02401.x
43. Davis-Jr. K.B., and McEntire M.E., Comparison of the cortisol and glucose stress response to acute confinement and resting insulin-like growth factor-I concentrations among white bass, striped bass and sunshine bass, Aquaculture America Book of Abstracts, 2006, 79p.
44. Rotllant J., and Tort L., Cortisol and glucose responses after acute stress by net handling in the sparid red porgy previously subjected to crowding stress, Journal of Fish Biology, 1997, 51:21-28. DOI:10.1111/j.1095-8649.1997.tb02510.x
45. Wood C.M., Walsh P.J., Thomas S., and Perry S.F., Control of red blood cell metabolism in rainbow trout after exhaustive exercise, Journal of Experimental Biology, 1990, 154:491- 507. DOI:10.1242/jeb.154.1.491
46. Burton D., and Burton M., Essential Fish Biology: Diversity, structure, and function, New York, Oxford University Press, 2017, 424p. DOI:10.1093/oso/9780198785552.001.0001
47. Jen-Lee Yang and Hon-Cheng Chen, Effects of gallium on common carp (Cyprinus carpio): acute test, serum biochemistry, and erythrocyte morphology, Chemosphere, 2003, 53:877-882. DOI:10.1016/S0045-6535(03)00657-X
48. Biswal A., Srivastava P.P., Krishna G., Paul T., Pal P., and Gupta S., An intergrated biomarker approach for explaining the potency of exogenous glucose on transportation induced stress in Labeo rohita fingerlings, Scientific Reports, 2021, 11. DOI:10.1038/s41598-021-85311-5
49. Fazio F., Saoca C., Capillo G., Iaria C., Panzera M., Piccione G., and Spanò N., Intra-variability of some biochemical parameters and serum electrolytes in rainbow trout (Walbaum, 1792) bred using a flow-through system, Heliyon, 2021, 7. DOI:10.1016/j.heliyon.2021.e06361
50. Oner M., Atli G., and Canli M., Changes in serum biochemical parameters of freshwater fish Oreochromis niloticus following prolonged metal (Ag, Cd, Cr, Cu, Zn) exposures, Environmental Toxicology and Chemistry, 2008, 27(2):360-366. DOI:10.1897/07-281R.1
51. Moradi N., Imanpoor M., and Taghizadeh V., Hematological and biochemical changes induced by replacingfish meal with plant protein in the Cyprinus carpio Linnaeus (1785), Global Veterinaria, 2013, 11(2):233-237. DOI:10.5829/idosi.gv.2013.11.2.7533
52. Canfield P.J., Quartarado N., Griffin D.L., Tsoukalas G.N., and Cocaro S.E., Haematological and biochemical reference values for captive Australian snapper, Pagrus auratus, Journal of Fish Biology, 1994, 44:849-856. DOI:10.1111/j.1095-8649.1994.tb01259.x
53. Price A.S., and Wilson L.M., Pathophysiology: clinical concepts of disease processes [In Indonesian], 4th ed., Jakarta, Indonesia, EGC, 1995, 717 p.
54. Pratt D.S., Liver chemistry and function test, in Sleisenger and Fordtran’s gastrointestinal and liver disease, M. Feldma, L.S. Friedma, & L.J. Brandt, Editors. Saunders Elsevier: Philadelphia, 2010, p. 2480. DOI:10.1016/B978-1-4160-6189-2.00073-1
55. Hastuti S., and Subandiyono S., Aminotransferase, hematological indices and growth of tilapia (Oreochomis niloticus) reared in various stocking densities in aquaponic systems, AACL Bioflux, 2020, 13(2):813-824.
56. Aragão C., Costas B., Vargas-Chacoff L., Ruiz-Jarabo I., Dinis M.T., Mancera J.M., and Conceicão L.E.C., Changes in plasma amino acid levels in a euryhaline fish exposed to different environmental salinities, Amino Acids, 2010, 38:311-317. DOI:10.1007/s00726-009-0252-9
57. Sangiao-Alvarellos S., Arjona F.J., Martín del Río M.P., Míguez J.M., Mancera J.M., and Soengas J.L., Time course of osmoregulatory and metabolic changes during osmotic acclimation in Sparus auratus, Journal of Experimental Biology, 2005, 208:4291-4304. DOI:10.1242/jeb.01900
58. Mian J., and Siddiqui P.Z.J.A., Effect of salinity and protein levels on haematological, and physiological changes and growth of hybrid tilapia (Oreochromis mossambicus × Oreochromis niloticus), Iranian Journal of Fisheries Sciences, 2020, 19(3):1268-1279. DOI:10.22092/IJFS.2018.116553