FLUXES OF ENERGY, WATER AND CO2 ABOVE A TROPICAL MONSOON FOREST IN DONG NAI: RESULTS OF 10 YEARS OF MEASUREMENTS
A. N. Severtsov Institute of Ecology and Evolution, Russian Academy of Sciences, Russian Federation, Southern Branch of Joint Vietnam-Russia Tropical Science and Technology Research Centre
Main Article Content
Abstract
This paper explores over 10 years of continuous measurements of energy, water, and carbon dioxide fluxes at the first established eddy covariance site in Vietnam, located above a mature semi-evergreen tropical seasonal forest. Daily, seasonal, and interannual variations of turbulent fluxes and meteorological parameters were analyzed.
Evapotranspiration decreased in the second half of the dry season, and the net ecosystem exchange of CO₂ shifted to positive values (indicating the tropical forest becomes a CO₂ source rather than a sink) during the hot-dry period of the year (March-May). Net radiation showed minimal interannual and seasonal variation. In contrast, precipitation varied significantly from year to year, with pronounced differences between dry seasons.
These precipitation variations influenced the annual rate of evapotranspiration but did not significantly affect the annual net ecosystem exchange of CO₂. Overall, the tropical forest ecosystem acted as a substantial net sink of CO₂ from the atmosphere.
Keywords
Eddy covariance, seasonally dry tropical forest, Dong Nai, net ecosystem excange, evapotranspiration
Article Details
1. INTRODUCTION
In contrast to the temperate and boreal forests, tropical forests remain active throughout a year, hence their productivity and evapotranspiration (E) on the annual scale is more than twice as much as in other types of forests [1]. The land-atmosphere exchange of energy, water, green house gases between the tropical forests and the atmosphere influence the global climate. However, these large ecosystem-atmosphere fluxes strongly depend on the seasonal and interannual climate fluctuations. In the most part of the tropics, belonging to the climate of tropical monsoons, the leading factor of environmental change is dramatical change of precipitation (Pr) between wet and dry season and sometimes between consequent years [2, 3].
It has been shown that intact tropical forests serve as a sink of carbon, slowing down the process of global warming reported that tropical seasonal forests showed a negative NEP (CO2 source) during the dry period, and a positive NEP (CO2 sink) in the rainy season [4, 5]. As regards tropical forests, great uncertainty still exists about their role in global surface-atmosphere carbon exchange. The uncertainty is connected to the lack of multiyear high-quality continuous observations of carbon fluxes in tropical forests.
Energy, water and CO2 exchange in the tropical forests of South East Asia (SEA) were previously studied in Thailand, Cambodia, Southwest China, Malaysia and Indonesia. A certain number of works, especially of the last 5 years, concern the multiyear series of measurements of ecosystem gas fluxes. However, the majority of the abovementioned papers report the results of 3-4 years of measurements, and 10 years of continuous measurements are still of great value for tropical ecosystems. Tanaka et al. found opposite reaction of evapotranspiration (E) in two evergreen forests of Thailand and Cambodia to the dry season with higher radiation and water vapour pressure deficit (VPD). The authors also accented the need for further studying the changes of SEA seasonal forests to inter- and intra-annual anomalies of Pr [6].
In frame of the studies of ecosystem ecology in Vietnam conducted in the Joint Vietnam-Russia Tropical Science and Technology Research Centre (VRTC) for more than 30 years, in 2011 the measurements of ecosystem fluxes of carbon dioxide, energy and water started in a primary tropical forest in the Dong Nai biosphere reserve, Southern Vietnam. The results of the previous VRTC studies of climate of Southern Vietnam, water fluxes, energy fluxes and concentrations of CO2 were presented in a number of publications [7-10].
2. SITE AND METHOD
2.1. Sampling site
The meteorological and flux measurements were hold in the Dong Nai biosphere reserve (former Nam Cat Tien National Park) in the Southern Vietnam. In AsiaFlux, Asian network of stations of the measurements of ecosystem fluxes, our site is abbreviated as NCT in ASIAFLUX (http://asiaflux.net/index.php?page_id=86). The reserve on the territory was established in 1997. The measurement site (11°27'N, 107°24'E, 150 m a.s.l.) is located in the respectively homogeneous massive of lowland mixed tropical forest. The area is partly flooded in a wet season, but in dry season numerous puddles, lakes and streams dry up.
The climate type according to Köppen - Geiger classification, with dry period from November to April. Mean annual rainfall and air temperature (T) were 2518 mm and 26.4°C, respectively, for the period 1980 - 2010 at nearby Dong Xoai weather station. In years of El Niño events Pr in a dry season decreases and T of a hot-dry part of a year increases [7].
According to Kuznetsov, Kuznetsova, dominating at drained places are Lagerstroemia calyculata (Lythraceae), Haldina cordifolia (Rubiaceae), Tetramelas nudiflora (Datisceaeae), Afzelia xylocarpa (Caesalpiniaceae), Sterculia cf. cochinchinensis (Sterculiaceae) [8]. The forest is primary but probably disturbed in the second part of XX century by human activity (selective cutting, getting resin, etc.). The forest has the complex vertical structure and rich biodiversity with high dominance of a few species. The canopy height is 30 m and woody stock is about 220 m3/ha. The forest is semi-evergreen: about half of individual trees of upper sub-layers shed their leaves in a dry season [9]. Leaf area index (LAI) is 5.1±0.9 m2/m2 (n=52). Soils belong to the dry Skeletic Rhodic Cambisol (Clayic) according to World Reference Base (WRB) classification, with a 2 - 3% of organic carbon and 0.45 - 0.22% of nitrogen in the upper layer and have a sufficient amount of phosphorus and potassium.
2.2. Measurements
The turbulent fluxes were measured using eddy covariance (EC) technique during the four seasons of the year with a duration of more than 10 years (11/2011-2022). The EC equipment was placed at a 50 m height steel tower. NEE heat, CO2 fluxes and water started in primary evergreen forest using the EC technique. The heat flux (H) were collected with an infrared gas analyzer (LI-7500A, LI-COR Biosciences Inc., USA) and 3-dimensional sonic anemometer-thermometer (CSAT3, Campbell Scientific, USA).
Campbell Scientific Inc., USA). Shortwave and longwave components of radiation, P, T and relative humidity were registered at 50 height. 5 soil heat flux plates were installed at the depth of 30 cm. CO2 and heat storage in the air and forest canopy were calculated using 8-level profile measurements of CO2 concentrations and T, respectively. The system of CO2 profile included LI-820 gas analyzer. Three profiles of soil water content and temperature to the depth of 50 cm were installed.
2.3. Data analysis
The final database covers the period from 11/2011 to 08/2022 and include 10 full years (2012-2021). The turbulent CO2 and heat fluxes for each 30-min period were calculated by means of an open-source EddyPro software (LI-COR Biosciences Inc., USA) with all standard EC corrections (frequency response; Webb-Pearman-Leuning correction etc.). Gaps in H, LE and NEE in 2012-2016 made up 34%, 41% and 61%, respectively. For NEE, in night-time/day-time 79%/31% of values were missed, respectively. Gaps in fluxes were filled using updated look-up tables method in Online Eddy Covariance gap-filling and flux-partitioning tool (Max-Plank Institute, Germany). Different gap-filling methods of Flux Analysis Tool, Japan [12] were used for fluxes uncertainty evaluation. The estimation of flux totals uncertainty depending on different gap-filling procedures for 2012 revealed the non-stability of totals and their strong dependence on night-time gaps and spikes, especially in the wettest months. As a most suitable method for gap-filling of these periods was recognized the method from [13]. The data on each step of processing (raw data, 30-minute fluxes, storages) were despiked (peak values excluded) and checked for physical plausibility. The ABD software by A. Deshcherevsky was used for the analysis [14, 15, 16].
The energy balance non-closure, typical for EC measurements [17], made up at our site from 11 to 31% of the available energy for different months, averaged 20%. We assumed that the turbulent fluxes had been underestimated and added the additional energy at daily, monthly and annual totals of H and LE using the Bowen ratio H/LE.
The prevailing winds at the site had a south-western direction during the dry season the winds were northern. 90% of the measured fluxes were collected in the dry season with the wind of 70 m (380 m in day-time and 1360 m in night-time).
Annual sums of Pr in 2016 and 2018 were not calculated due to the absence of records of annual precipitation gaps were filled using the data from the nearby sensors or average annual variation in a moving window using adjacent data round the gap. Net radiation (Rn) since the second half of 2013, and H data, were measured by different instruments. Both radiation sensors were installed at the height of 30 m in the forest canopy along-way recalculated. T in the canopy, the second tier and the understory were measured at a height of 1 m above the ground, soil flux, and H in different layers in case of failure of the main EC sensors occurred after a lightning strike.
3. RESULTS AND DISCUSSION
3.1. Weather conditions
A wet season at NCT is relatively uniform in different years, but a dry season has great variations from year to year. The seasonality of the turbulent fluxes depends not only on the duration and the amount of rain in a dry season, but also on the date of transition from a dry season to a wet season. The late transition means drought is combined with the highest T throughout a year (April-May), which cause the stress for the vegetation. According to the criteria of borders of seasons [10], the average dates of start and end of a wet season are 19.04±18 days and 16.11±16 days (2011-2022). The beginning and the end of a wet season may shift by a month in some years (Table 1).
Table 1. The start and the end of a wet season at NCT according to the criteria of highlighted are the late beginnings of the wet seasons
| Year | 2011 | 2012 | 2013 | 2014 | 2015 | 2016 | 2017 | 2018 | 2019 | 2020 | 2021 | 2022 |
|---|---|---|---|---|---|---|---|---|---|---|---|---|
| Begin | 11.11 | 24.01 | 20.03 | 21.06 | 12.04 | 22.11 | 23.11 | 20.11 | 23.06 | 13.05 | 15.04 | 28.04 |
| End | 11.11 | 24.01 | 20.10 | 26.10 | 21.11 | 27.11 | 23.11 | 20.11 | 27.11 | 30.11 | 11.11 | 30.11 |
Pr in a dry season with high water supply may reach 20-50 mm per month, but in a dry season with scarce water supply Pr may be as low as few millimeters of rain during a 4-month period. The seasonal course of shortwave radiation (Rs), T, VPD is characterized with the maximum in the end of a dry season (hot-dry period), which fall on March-May (Fig 1). The coefficient of variation of annual precipitation between years was 13.1% (Table 2), and the most important for ecosystem processes is the variation of the amount of Pr between seasons.
In the years of 2016 and 2020 the dry season had little Pr (Fig. 1) and expanded by the first half of May. The monthly T in April and May of 2016 reached 28.5°C. Values of T in the profile of canopy averaged for 30 minutes increased to as high value as 40°C. By contrast, the first halfs of 2012 and 2017 years were relatively wet and the monthly T in the hottest months not exceeded 27°C. Volumetric soil water content was as low as 10% (close to the wilting point) in the hot-dry part of years of 2016 and 2020, but in the dry seasons of 2011-2012 and 2016-2017 it did not dropped below 15%.

3.2. Heat balance and evapotranspiration
Our previous results about the high energy supply, i.e. Rn, in NCT are confirmed by the recent years of measurements. Averaged for the period of 2012-2021 Rn was 4995±156 MJ/m2, which is among the highest values for 21 EC stations in tropical forests of the world [13, 18 - 21]. Moreover, Rn is stable (Fig. 2, Table 2): the coefficient of variation (a standard deviation divided on an average value) of instrumental values of Rn made 3.1%, which is a small value per se and in comparison with other sites of measurements across the tropics. The feature of the seasonal distribution of Rn in NCT is that it is on average 6% higher in the wet half of a year (16th April-15th October) in comparison with a dry half of a year (16th October-15th April), which is favourable for vegetating.
Table 2. Annual totals of fluxes at NCT site: solar radiation (Rs), precipitation (Pr), evapotranspiration (E), net ecosystem exchange (NEE)
| Flux | Unit | 2012 | 2013 | 2014 | 2015 | 2016 | 2017 | 2018 | 2019 | 2020 | 2021 |
|---|---|---|---|---|---|---|---|---|---|---|---|
| Rs | MJ/m2 | 6714 | 6536 | 6744 | 7127 | 6614 | 6629 | 6763 | 7005 | 6882 | 6734 |
| Pr | mm/y | 2621 | 2634 | 2333 | 2711 | 2550 | 2436 | 2730 | 2438 | 2562 | 2640 |
| E | mm/y | 1560 | 1485 | 1522 | 1368 | 1681 | 1620 | 1475 | 1610 | 1475 | 1611 |
| NEE | gC/m2 | -374 | -514 | -479 | -408 | -566 | -653 | -533 | -510 | -331 | -333 |
Note: The negative sign of NEE means that the ecosystem is the net sink of CO2 from the atmosphere.
The heat turbulent fluxes, i.e. LE and H, are characterized by distinct opposite seasonality (Fig. 2).

Ecosystem evapotranspiration was affected by the net radiation much more than on the amount of Pr, except for two-three driest months of a year. In a hot-dry period of a year (last 60 days of a dry season) evapotranspiration decreases by 60-80% of the level in the wet conditions and H increases by about 2 times. The proportion between H and LE, i.e. the Bowen ratio, boosts from usual ‘wet’ rate of 0.12-0.15 up to 1 and more. Meanwhile, in relatively wet dry seasons (2012, 2017, 2021) Bowen ratio did not exceed 1 in all months of the years, which means permanently wet conditions. But in the driest dry seasons (2016, 2020) it reached 1.5-2, indicating the conditions with the lack of water.
The threshold of monthly averaged volumetric soil water content, or SWC (0.19 m3/m3) was detected, under which the value of E begin to drop proportionally to the decreasing SWC [10]. SWC decreases under this threshold by one or two months in a humid dry season and by 5 months in a droughty dry season.
The annual total of E at NCT was 1541±193 mm, which is on a level of a rain (permanently wet) forests, despite a dry season of several months in Southern Vietnam. The high evapotranspiration rate is connected with the diurnal course of cloudiness at NCT, with relatively open sky in the noon-time even in a wet season and the average peak of Pr in the evening [8]. E is relatively stable seasonally and interannually, depending first of all on the net radiation. In 4 driest months of a year LE totals reduced only by 21% (9-year average) in comparison with 4 wettest months.
The long record allowed the investigation of the response of turbulent ecosystem-atmosphere exchange to the intense drought of April-May 2016. The droughty and hot weather during the El-Nino event in the hot-dry period of 2016 dramatically changed the structure of heat balance, sharply increasing H and T. However, the level of ecosystem E still was relatively high (60 mm per April of 2016), accounting for 4-month almost absent Pr. This demonstrates the resilience of a tropical forest to droughty conditions due to complex vertical structure and the possibility of using of moisture from the deep soil layers. The albedo of the forest was the same in April 2016 as in hot-dry periods of other years, marking that forest preserved the cover of green leaves even in the conditions of drought occurring once in 10-20 years.
3.3. CO2 fluxes
NEE was negative in the most part of a year, and switched to the positive values in a hot-dry period (Fig. 3). The secondary lower maximum of NEE was observed in the November-December, probably due to the decaying of organic matter in drying lakes and puddles.
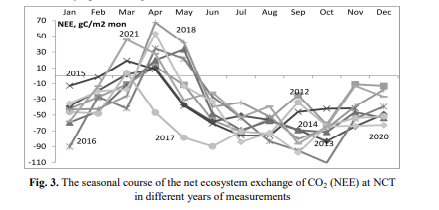
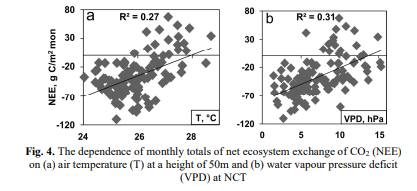
The coefficient of variation of interannual values of NEE made up 23.7%, which is the highest value in comparison with variations of annual energy (Rn) and water (Pr) supply. Monthly NEE increased and switched from negative (ecosystem is a sink of carbon from the atmosphere) to positive (ecosystem is a source of carbon for the atmosphere) values with the growing T and VPD (Fig. 4).
However, the effect of higher CO2 emission in the hot-dry period and beginning of a wet season in drier years may be compensated with more intensive CO2 assimilation in the other parts of a year, that’s why the dependence of annual NEE on T and VPD was absent.
According to the measurements, the forest at NCT was the net sink of CO2, which varied annually from 330 to 650 gC m-2 y-1 (Table 2), the average value was -463±110 gC m-2 y-1. This value is lower than in other tropical forests except mangroves, which may be explained by the recovery of the forest from the past disturbances. The reasons for forest functioning as a sink of carbon need detailed study of the carbon balance of the ecosystem, including soil carbon pool, accounting of the dissolved organic carbon in streams, moving parts of carbon and branches by the surface runoff etc. GPP in 2012-2017 accounted to about 3650 gC m-2 y-1 and ecosystem respiration was about 3150 gC m-2 y-1. The rate of GPP in the driest months accounted for 43% of a dry season value, and the rate of GPP in the two wettest months amounted to 56%, for Reco it was 55%, and for E it was 63%. Hence, ecosystems respiration and GPP are the processes that are more influenced by the dry conditions, while the moisture flux - E - is less affected by drought.
The coefficient of interannual variation of the main ecosystem mass and energy fluxes increases in the following sequence: Rn (3.1%) < E (6.5%) < GPP (7.1%) < Reco (8.8%) < Pr (13.1%) < H (17.3%). The coefficient of variation of NEE was 23.7%. Both water and carbon turbulent fluxes depended on the variation of Pr in a dry season, but the ecosystem smoothed the fluctuations of Pr while forming E and GPP. Ecosystem respiration was the most variable flux in comparison with E and GPP.
4. CONCLUSION
The station of eddy covariance measurements in Dong Nai, Southern Vietnam, established in 11/2011, has been working continuously for more than 10 years. In 2022, it is one of the longest and high-quality series of turbulent fluxes in a tropical forest in the world. The database for the site includes 185000+ rows of values of more than 30 parameters averaged for each 30 minutes.
The studied forest receives stable energy supply (net radiation), but significantly changing precipitation input. The variation of convective heating of the atmosphere and CO2 fluxes between years is relatively broad.
- The studied forest was the significant sink of CO2 from the atmosphere in 2012-2021, at a rate of 330 to 650±150 g C m-2 year-1, therefore playing a role of mitigator of the global warming. However, droughty and hot conditions may switch the ecosystem from a carbon sink to a source for the atmosphere.
- Though the structure of the heat balance during the intense drought of April-May 2016 has changed significantly, ecosystem evapotranspiration remained at the relatively high level and the CO2 assimilation recovered at the beginning of a consequent wet season. This reaction demonstrates the resilience of the tropical forest at NCT to the strong drought.
Acknowledgements: We are grateful to the management of Dong Nai biosphere reserve. We thank the administration and our colleagues from the Joint Vietnam-Russia Tropical Science and Technology Research Centre for supporting the observations at the tower.
References
2. Bullock S. H., Mooney H. A., Medina E., Seasonally dry tropical forests, Cambridge University Press, Cambridge, 1995, 450 p.
3. Dirzo R., Young H. S., Mooney H. A., Seasonally dry tropical forests: ecology and conservation, Island Press, Washington, 2011, 408 p.
4. Baccini A., Walker W., Carvalho L., Farina M., Sulla-Menashe D., and Houghton R. A., Tropical forests are a net carbon source based on aboveground measurements of gain and loss, Science, 2017, 358(6360):230-234.
5. Saigusa N., Yamamoto S., Hirata R., Ohtani Y., Ide R., Asanuma J., Gamo M., Hirano T., Kondo H., Kosugi Y., Li S. G., Nakai Y., Takagi K., Tani M., Wang H., Temporal and spatial variations in the seasonal patterns of CO2 flux in boreal, temperate, and tropical forests in East Asia, Agricultural and Forest Meteorology, 2008, 148(5):761-775.
6. Tanaka N., Kume T., Natsuko Yoshifuji N., Tanaka K., Takizawa H., Shiraki K., Tantasirin C., Tangtham N., Suzuki M., A review of evapotranspiration estimates from tropical forests in Thailand and adjacent regions, Agricultural and Forest Meteorology, 2008, 148:807-819.
7. Deshcherevskaya O. A., Avilov V. K., Dinh Ba Duy, Tran Cong Huan, Kurbatova J. A., Modern climate of the Cát Tiên National Park (Southern Vietnam): Climatological data for ecological studies, Izvestiya, Atmospheric and Oceanic Physics, 2013, 49(8):819-838.
8. Kuznetsov, Kuznetsova, Лесная растительность: видовой состав и структура древостоев, в сб. Структура и функции почвенного населения тропического муссонного леса (национальный парк Кат Тьен, Южный Вьетнам), под общей редакцией А.В. Тиунова, Товарищество научных изданий КМК, Москва, 2011, p.16-43.
9. Kuricheva O. A., Avilov V. C., Dinh D. B., Kurbatova J. A., Water cycle of a seasonally dry tropical forest (Southern Vietnam), Izvestiya, Atmospheric and Oceanic Physics, 2015, 51(7):693-711.
10. Kurbatova Yu. A., Kuricheva O. A., Avilov V. K., Dinh Ba Duy, Kuznetsov A. N., Fluxes of Energy, H2O, and CO2 between the Atmosphere and the Monsoon Tropical Forest in Southern Vietnam, Doklady Biological Sciences, 2015, 464(2):235-238.
11. Kuricheva O. A., Avilov V. K., Dinh D. B., Sandlersky R. B., Kuznetsov A. N., Kurbatova J. A., Seasonality of energy and water fluxes in a tropical moist forest in Vietnam, Agricultural and Forest Meteorology, 2021, 298:108268.
12. Ueyama M., Hirata R., Mano M., Hamotani K., Harazono Y., Hirano T., Miyata A., Takagi K., Takahashi Y., Influences of various calculation options on heat, water and carbon fluxes determined by open-and closed-path eddy covariance methods, Tellus B, 2012, 64(1):19048.
13. Kosugi Y., Takanashi S., Tani M., Ohkubo S., Matsuo N., Itoh M., Noguchi S., Nik A. R., Effect of inter-annual climate variability on evapotranspiration and canopy CO2 exchange of a tropical rainforest in Peninsular Malaysia, Journal of Forest Research, 2012, 17(3):227-240.
14. Desherevskii A. V., Zhuravlev V. I., Nikolsky A. N., Sidorin A. Ya., Problems in analyzing time series with gaps and their solution with the WinABD software package, Izv. Atmos. Ocean Phys., 2017a, 53:659-678.
15. Desherevskii A. V., Zhuravlev V. I., Nikolsky A. N., Sidorin A. Ya., Technology for analyzing geophysical time series: Part 2. WinABD - A software package for maintaining and analyzing geophysical monitoring data, Seismic Instrum, 2017, 53:203-223.
16. Desherevskii A. V., Zhuravlev V. I., Nikolsky A. N., Sidorin A. Ya., Analysis of Rhythms in experimental signals, Izv. Atmos. Ocean Phys., 2017c, 53:847-858.
17. Foken T., The energy balance closure problem: An overview, Ecological Applications, 2008, 18(6):1351-1367.
18. Shuttleworth W. J., Observations of radiation exchange above and below Amazonian forest, Journal of the Royal Meteorological Society, 1984, 110:1163-1169.
19. Loescher H. W., Gholz H. L., Jacobs J. M., Oberbauer S. F., Energy dynamics and modeled evapotranspiration from a wet tropical forest in Costa Rica, Journal of Hydrology, 2005, 315(1):274-294.
20. Rocha Da H. R., Manzi A. O., Cabral O. M., et al., Patterns of water and heat flux across a biome gradient from tropical forest to savanna in Brazil, Journal of Geophysical Research, 2009, 114(G1).
21. Rodrigues T. R., de Paulo S. R., Novais J. W. Z., Curado L. F. A., Nogueira J. S., de Oliveira R. G., de A. Lobo F., Vourlitis G. L., Temporal patterns of energy balance for a Brazilian tropical savanna under contrasting seasonal conditions, International Journal of Atmospheric Sciences, 2013.